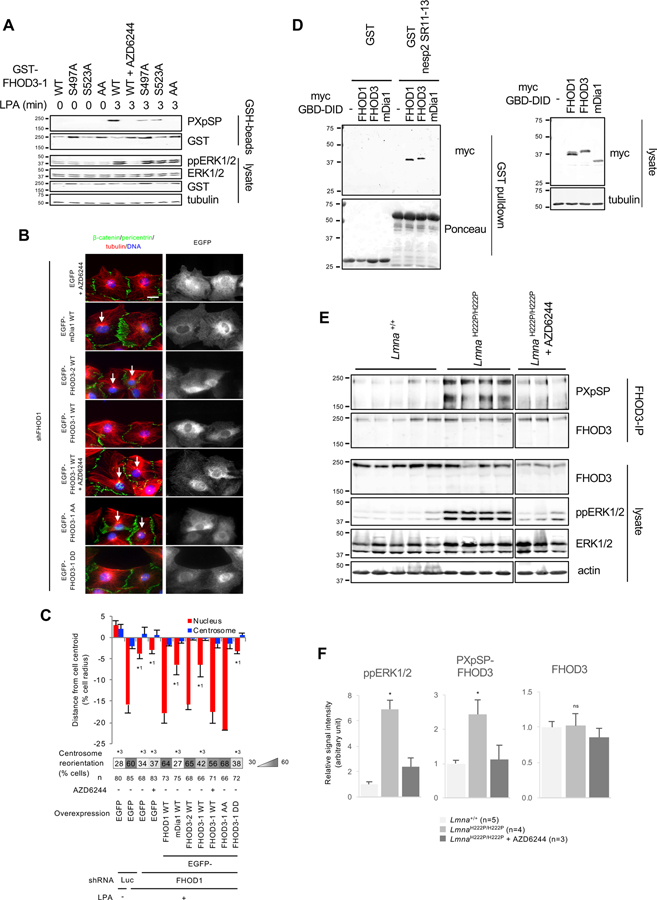
Figure 6. FHOD3 is inactivated by ERK1/2 phosphorylation and its phosphorylation is upregulated in hearts of LmnaH222P/H222P mice.
(A) Western blots (antibodies indicated to the right) of lysates from LPA-stimulated NIH3T3 fibroblasts expressing the indicated GST-FHOD3-1 constructs. GST proteins were capture on GSH-beads before western blotting. FHOD3-1 AA carries S497A and S523A mutations. (B) Images of LPA-stimulated wound-edge NIH3T3 fibroblasts stained for the indicated proteins and with DAPI. FHOD1 was depleted from cells using shRNA and the indicated constructs were expressed. FHOD3-1 DD carries S497D and S523D mutations. White arrows, oriented centrosomes. Bar, 20 μm. (C) Centrosome and nuclear positions and centrosome orientation in LPA-stimulated NIH3T3 fibroblasts knocked down for FHOD1 and expressing the indicated constructs as in B. Values are means ± SEM; n, cells examined. Centrosome orientation is shown in the heat map bars below the histograms. *1 and *2 indicate p < 0.05 compared to the rest of samples for each category. *3 indicates p < 0.05 compared to LPA-stimulated control. (D) Western blots (antibodies indicate on the right) of lysates from 293T cells transfected with the indicated constructs and the pulldown of GST or GST-nesprin2-SR11-13 against the lysates. Tubulin is a loading control. (E) Western blots (antibodies indicate on the right) of immunoprecipitated FHOD3 and lysates from heart tissue of 27-week-old Lmna+/+ mice, LmnaH222P/H222P mice and LmnaH222P/H222P mice treated with AZD6244. GAPDH is a loading control. (F) Quantification of western blot signals showing means ± SEM (n indicated in figure) from western blots as in E. *p < 0.05 compared to the rest of samples. ns indicates p > 0.05 compared to the rest of samples. In A, D, and E, migration of molecular mass standards (kDa) is indicated at the left of each blot. See also Figure S5.

