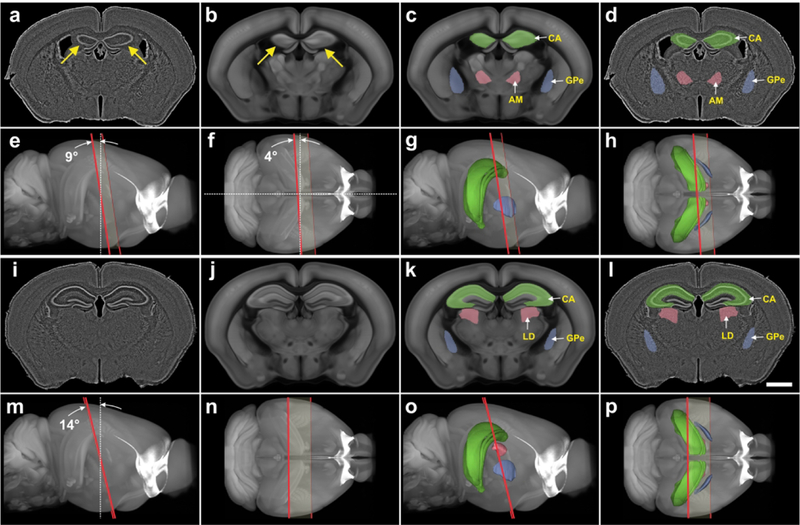
FIGURE 4.

Automatic identification and delineation of regions in mouse brain sections with cutting angles deviating from canonical planes. (a, i) Digital images of nearly coronal 80 μm thick frozen experimental sections of the brain from a Cre-driver mouse (from the GENSAT project; only fluorescent Nissl counterstain shown in gray). Note the asymmetry of the hippocampus between the left and right brain half (arrows in a). (b, j) The best fitting oblique angle slices that correspond to the experimental sections shown in a and i, that were automatically extracted from the 3D reference image of the CCF v3. The asymmetry of the hippocampus between the left and right brain half is also found in the slice shown in b (arrows). (c, k) The slices shown in b and j, with semitransparent overlay of three regions automatically extracted from the spatially aligned 3D reference image of the CCF v3. (d, l) The sections shown in a and i, with automatic semitransparent overlay of the regions shown in c and k. (e-h and m-p) Plane of section (red lines) of the slices shown in b and j through the 3D reference image of the CCF v3, with (g, h, o, p) and without (e, f, m, n) display of the regions shown in c and k contained in the spatially aligned 3D annotations of the CCF v3. (e, g, m, o) view from the side; (f, h, n, p) view from dorsal. The plane of section of the slice shown in b was tilted at an angle of 9 degrees from the dorsal-ventral axis (white dotted line in and 4 degrees from the lateral axis (white dotted line in f) with respect to the coronal plane of the CCF v3. The plane of section of the slice shown in j was tilted at an angle of 14° to the coronal plane of the CCF v3 (white dotted line in m). Nevertheless, in both cases it was possible to automatically identify and delineate correctly regions in the experimental sections. For abbreviations, see list. The scale bar in l represents 2 mm in a, d, i, l.
