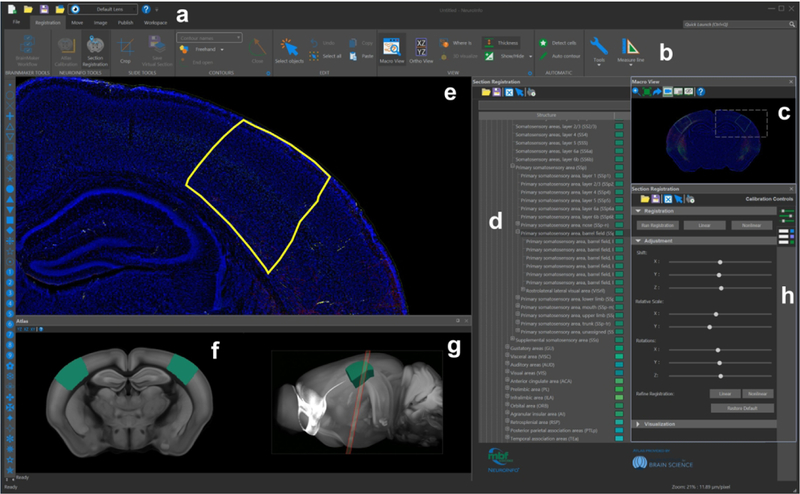
FIGURE 5.

The graphical user interface of NeuroInfo. The navigation menu (e) displays a sample image in the coronal plane, with barrel cortex structures selected in yellow and annotations in teal (d, ontology; f, g, reference space). (a, b, h): control toolboxes and viewers.
