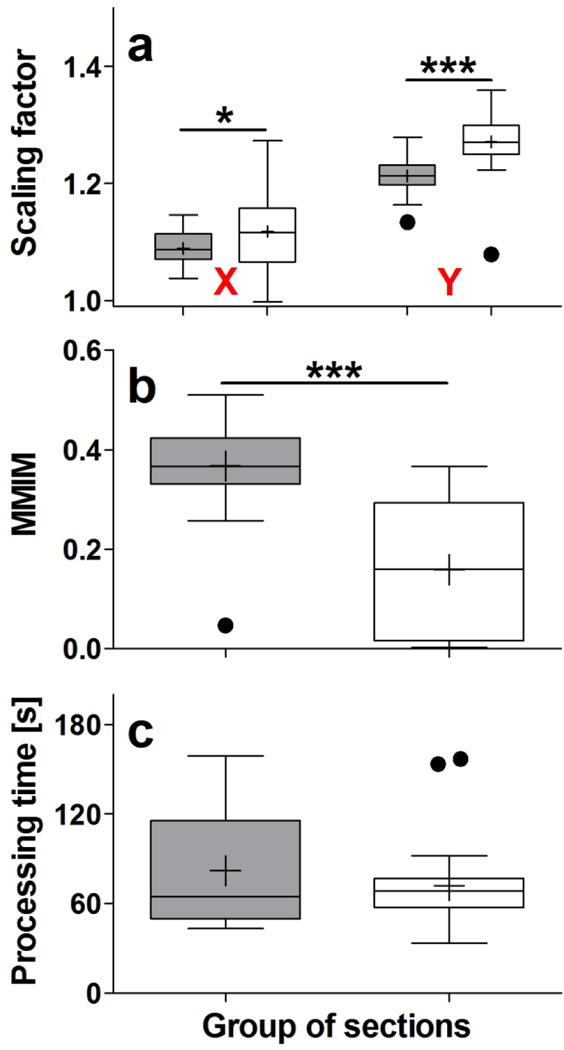
FIGURE 7.

Results of automatically registering 30 GENSAT section images (gray bars) and 30 CHDI section images (open bars) investigated in the present study with the 3D reference image of the CCF v3, using NeuroInfo. The panels show Tukey boxplots of (a) the scaling factors in X and Y, (b) the values obtained by calculating the Mattes mutual information metric (MMIM), and (c) the processing time, in seconds. Statistically significant differences between the groups are indicated in panels a and b (*; p < 0.01; ***, p < 0.001).
