
FIGURE 8.
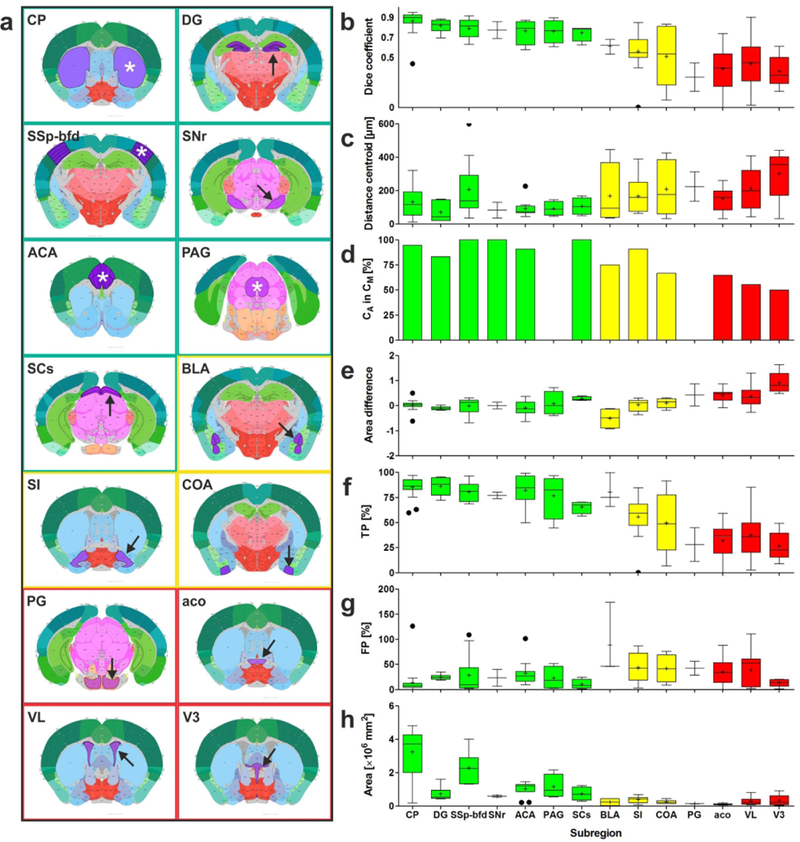
(a) Plates of 2D view of the CCF v3 showing those regions (marked by asterisks and arrows) that were investigated during the validation experiments. The colors of the frames match the colors of the bars in (b-h). (b-h) Results of the validation experiments, comparing manual delineations (Dms) performed by neuroanatomy experts (ground truth) with automatic delineations (Das) performed by NeuroInfo of the regions shown in (a) on 15 experimental section images of mouse brains. (b,c,e-h) Tukey boxplots of (b) the Dice coefficient, (c) the distance between the centroids of Da and Dm, (e) the difference between the areas of Da and Dm, (f) the percentage of area-Dm that was covered by area-Da (TP), (g) the amount of area-Da outside area-Dm expressed as a percentage of area-Dm (FP), and (h) the absolute area of Dm. (d) Relative number of Das in which the centroid of Da was found within both Da and Dm. Green, yellow and red bars indicate those regions for which the Dice coefficient was found to be >0.7, 0.5–0.7, <0.5, respectively. For abbreviations, see list.