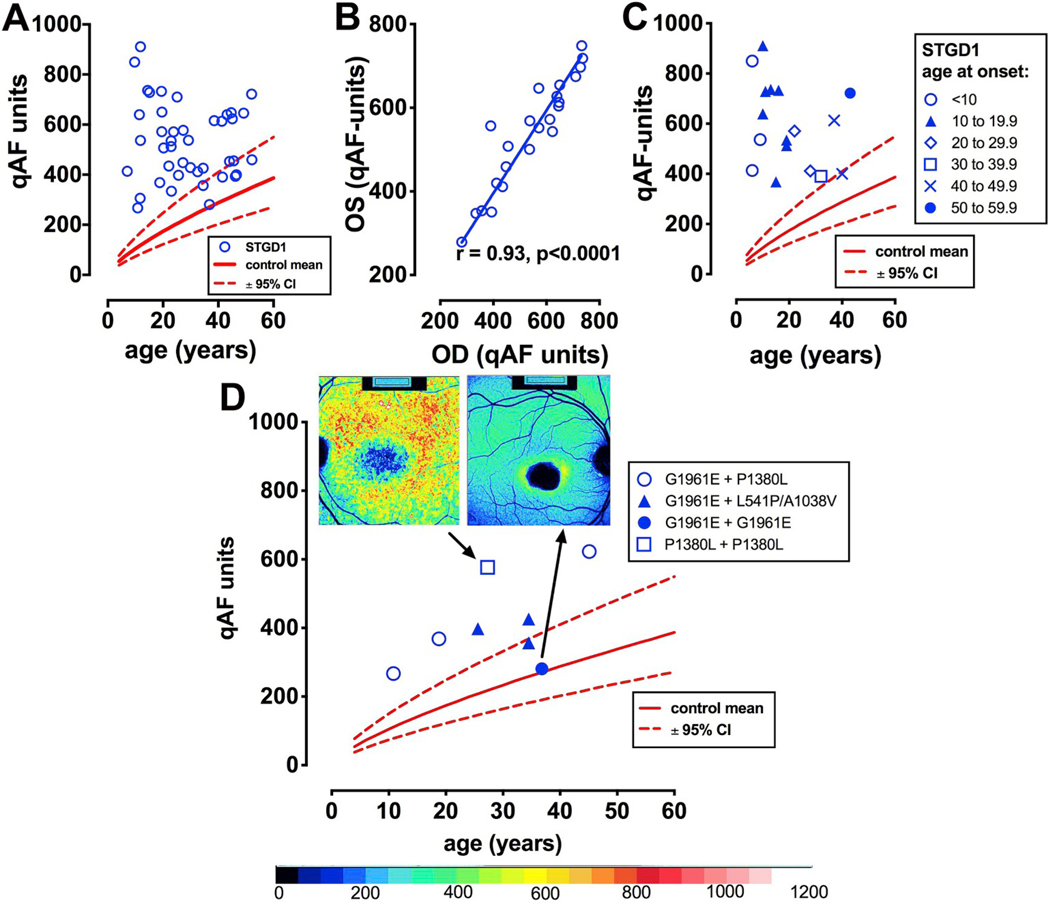
Fig. 6.
Quantitative fundus autofluorescence in recessive Stargardt disease (STGD1). A. qAF8 values (blue circles) are plotted as a function of age. Comparison is made to mean (solid red line) and 95% confidence intervals (dashed lines) for healthy eyes. B. Linear regression analysis indicates good correspondence between left (OS) and right (OD) eyes. C. Early age of STGD1-onset can be associated with higher levels of qAF. D. qAF8 versus age is plotted in relationship to some homozygous (p.G1961E; p. P1380L) and compound heterozygous (p.[G1961E; P1380L] [p.G1961E; p. L541/A1038V]) ABCA4 mutations. Insets at top, color-coded images and corresponding qAF values are shown for patients carrying homozygous G1961E and P1380L mutations. Adapted from Burke et al. (2014). (For interpretation of the references to color in this figure legend, the reader is referred to the Web version of this article.)

