Fig. 7.
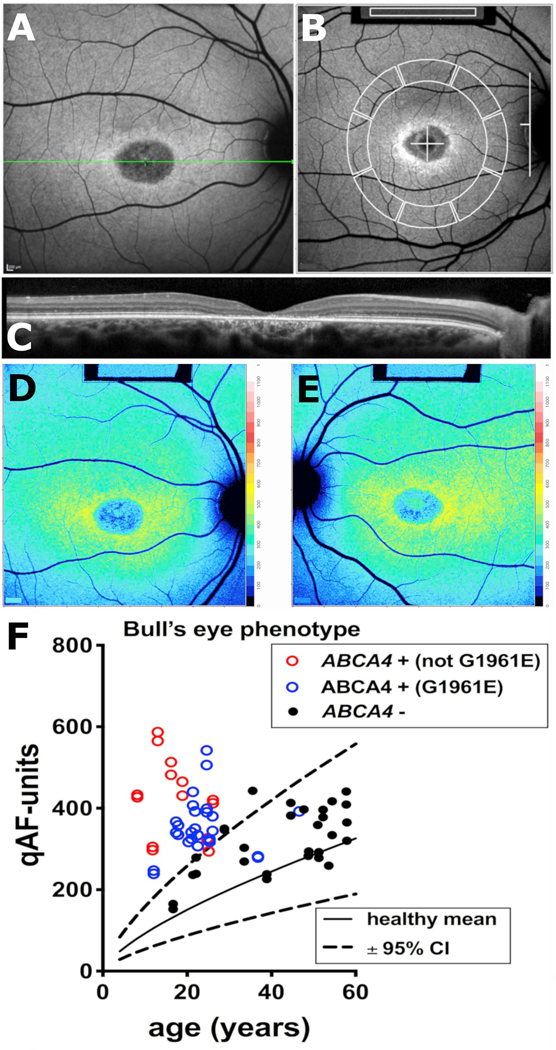
Fig. 7. Quantitative fundus autofluorescence in patients exhibiting bull’s eye lesions. A. Short-wavelength fundus autofluorescence image presenting with a central bull’s eye phenotype. B. qAF8 was calculated from mean grey levels recorded within 8 circularly arranged segments positioned with 7°–9° eccentricity. Grey levels within the internal reference (rectangle, top of image) were used to correct for sensitivity and laser power. C. Spectral domain optical coherence tomography. Atrophy of the outer nuclear layer, ellipsoid zone and interdigitation zone are appreciated along with hypertransmission of signal into the choroid. D, E. Color-coded qAF images of bull’s eye lesions (OD, OS) in a patient positive for ABCA4 mutations. Patient age 17 years. F. qAF values are plotted as a function of age for patients carrying ABCA4 mutations (ABCA4 +) not including the p. G1961E mutation (red circle); ABCA4 mutations including p. G1961E (blue circles); and patients who were negative for ABCA4 mutations (ABCA4 -) (black symbols) but exhibited a bull’s eye phenotype. Comparison is also made to mean (solid black line) and 95% confidence intervals (dashed lines) of healthy eyes. E. Adapted from Duncker et al. (2015b). (For interpretation of the references to color in this figure legend, the reader is referred to the Web version of this article.)

