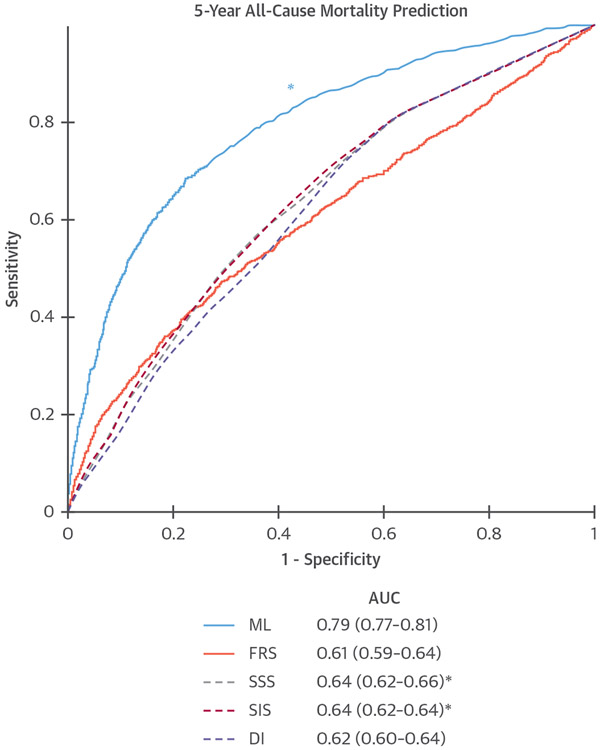
FIGURE 4. ML to Predict All-Cause Mortality.
Receiver-operating characteristic curves for prediction of death with 5-year follow-up compared to the Framingham risk score (FRS) and computed tomography angiography (CTA) severity scores (Segment Stenosis Score [SSS], Segment Involvement Score [SIS], modified Duke Index [DI]). *ML had significantly higher AUC than all other scores (P < 0.001). Reproduced with permission from Motwani et al. (23). AUC = area under the curve; ML = machine learning.

