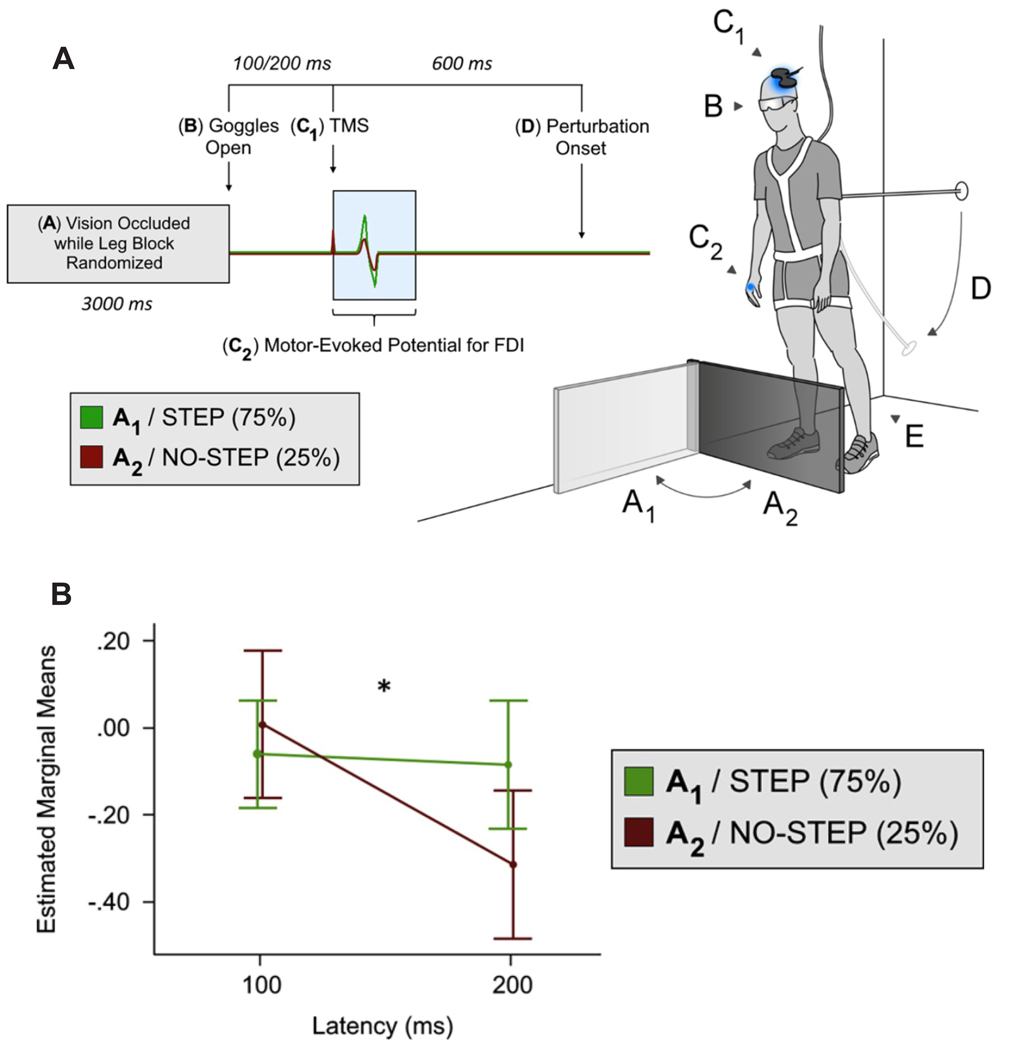
Figure 6. Modified lean & release task with leg block only (i.e., no option for grasping a support handle).
(A) This figure depicts MEP amplitude suppression in an intrinsic hand muscle when a leg block was presented (i.e., NO-STEP condition). (B) From the repeated measures ANOVA, the step condition x latency interaction, F1,18 = 4.47, p = 0.049, was significant. Visual inspection of the line graph 2 reveals decreasing MEP amplitude over time for the NO-STEP condition only and this was confirmed with follow-up comparisons. Specifically, these comparisons revealed a significant decrease at 200 ms compared with 100 ms t18 = 2.595, *p = 0.009 for the NO-STEP condition. By contrast, a similar comparison between 200 ms and 100 ms for the STEP condition reveals no difference t18 = 0.346, p = 0.367. Adapted from Figures 1 and 2, Goode et al.22. Please click here to view a larger version of this figure.

