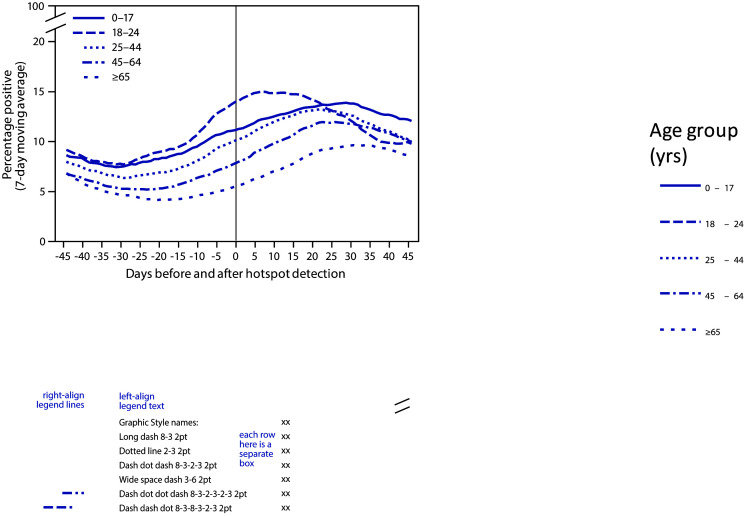
FIGURE 1.
Percentage of positive SARS-CoV-2 reverse transcription–polymerase chain reaction test results (7-day moving average)* in COVID-19 hotspot counties before and after date of hotspot detection, by age group — United States, June 1–July 31, 2020
Abbreviation: COVID-19 = coronavirus disease 2019.
* From COVID-19 electronic laboratory reporting data submitted by state health departments for 37 states and from data submitted directly by public health, commercial, and reference laboratories for 13 states and the District of Columbia, using specimen collection or test order date.

