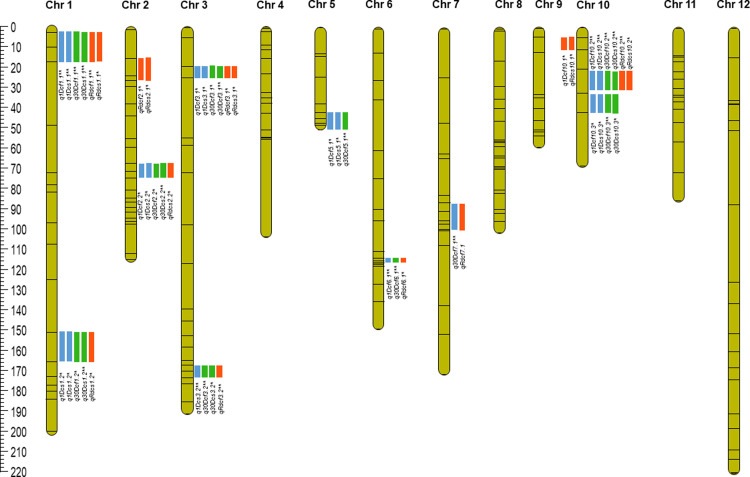
Fig 2. SNP- based genetic map and distribution of QTLs associated with delayed leaf senescence traits.
Chromosomes are numbered at the top and QTLs are listed on the right of each chromosome. Various color figures indicate the location of peak LODs of the six traits. QTL detected at heading are marked as * and 30 days after heading are marked as **.

