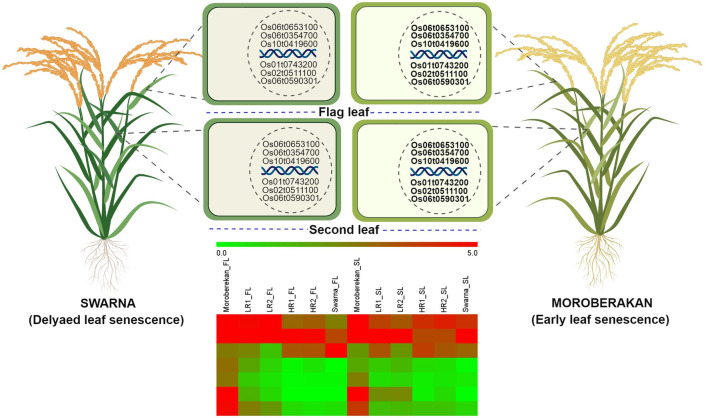
Fig 3. Gene expression model.
Expression of five genes (1) Os01t0743200 (Pectinesterase) (2) Os02t0511100 (Oxidoreductase, short chain dehydrogenase/reductase) (3) Os06t0590301 (short-chain dehydrogenase/reductase) (4) Os06t0653100 (Senescence-associated protein (5) Os10t0419600 (Chlorophyllase family protein) in flag and second leaf of Swarna (less senescent) and Moroberekan (more senescent) along with two early senescence and two delayed senescence lines. Bold letter represents higher expression and a normal letter represents less expression. Heatmap of six genes in flag and second leaf of Swarna, Moroberekan and phenotypic extreme BC2F4 derived lines viz., ELS-early leaf senescence and DLS- delayed leaf senescence. Expression is shown as log2 (FC) relative to second leaf of early senescence parent. Red marks genes that are upregulated and green for downregulated. The y-axis shows genes that co-regulate based on their directionality and magnitude. The x-axis shows different according to the legend.

