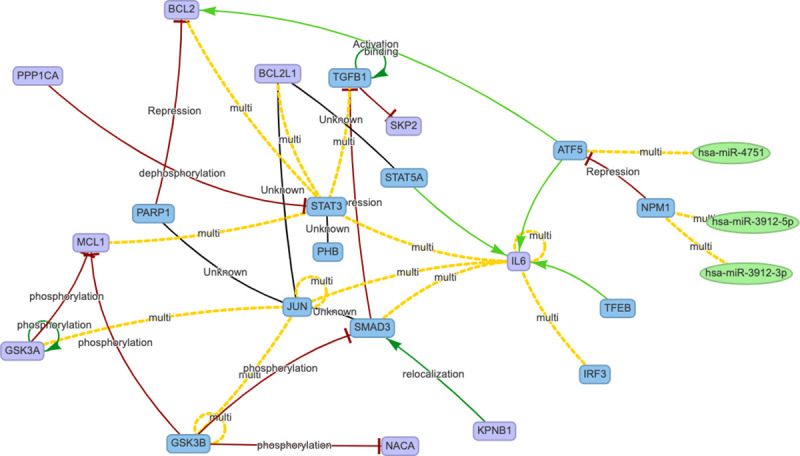
Fig 1. HCoV-host and IL-6 interactome cluster.

Nodes are represented as follow: genes in violet, transcription factors in blue, and microRNAs in green. Edges are marked in: red for inhibition/silencing effects, green for activation/silencing, black for undirected/unknown and yellow when multiple regulations are available in literature (see the list of all the interactions reported in Supplemental Material in S2 Table).
