
Fig 3. The most abundant bone bacteria at the different environments.
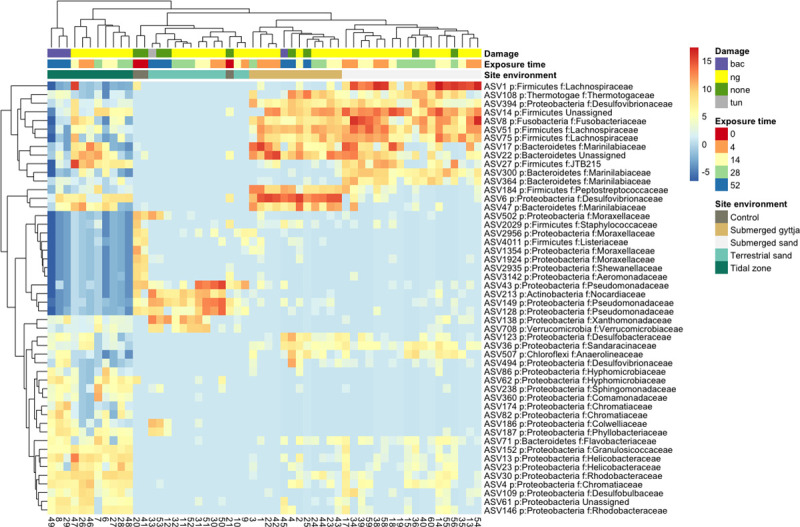
Heatmap showing the log2 relative abundance difference of the top 50 most prevalent ASVs in the bone samples that display a significant difference in relative abundance between environments, as determined by the DESeq test. Taxonomy of ASVs are shown at phylum and family levels. Damage as observed in the SEM analysis and abbreviations are as follows: bac: non-Wedl-tunnels (in Table 2), nd: no data, none: tunnels absent, Wed = Wedl tunnels.