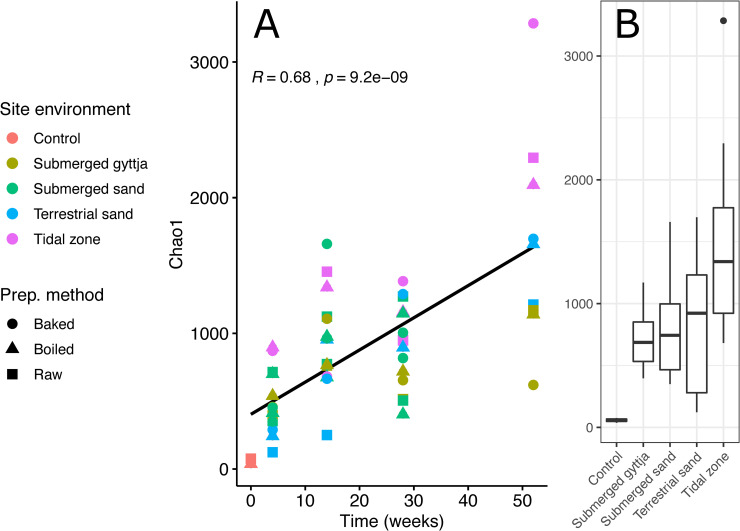
Fig 4. The diversity of bone bacteria over time.
Alpha diversity (Chao1 index) plot as a function of time. A) A Pearson correlation coefficient shows that Chao1 correlates significantly and positively with exposure time. The regression line is shown with 95% confidence interval. B) Boxplot showing the diversity at each environment within all samples. Boxplots indicate interquartile range and median value as solid horizontal lines. Whiskers extend to 1.5 * of the interquartile ranges, and outliers are shown as circles.

