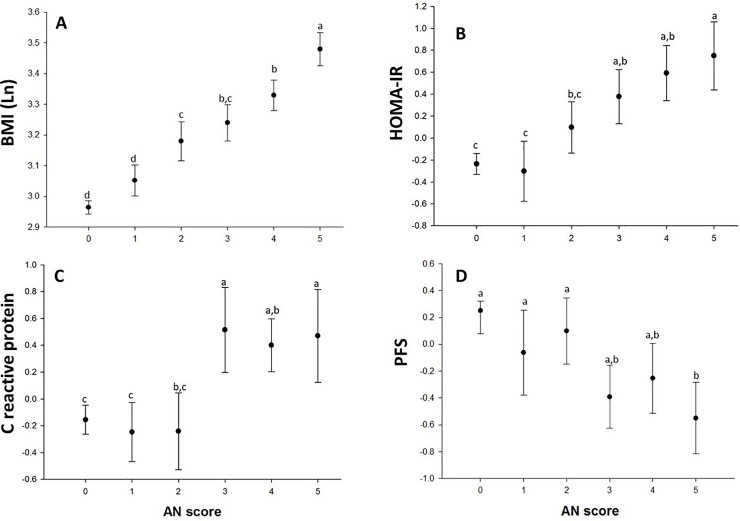
Fig 1.
Panel A. Positive association between BMI and AN-q. Panel B. HOMA-IR showed no difference between AN-q grade 0 vs. AN-q grade 1, but from AN-q grade 2 and so forth showed a positive relationship. Panel C. CRP showed no linear trend, but those with AN-q grade 3 and higher had elevated levels compared with lower scores. Panel D. PFS was inversely related with AN-q.

