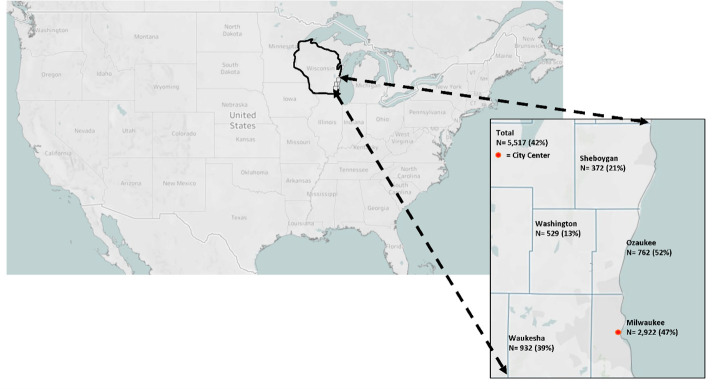
Fig 1. Mask-wearing percentages by Wisconsin county.
Data shown indicates the number of observations collected and percentage of people wearing a mask (vs. no mask) in each county where retail stores were visited during the initial data collection period from June 3rd through June 9th, 2020. The Milwaukee county city center location was used for identifying urban, suburban, and rural stores. Created in Tableau Public 2020.2.1 (Tableau Software, LLC., Seattle, WA, USA).

