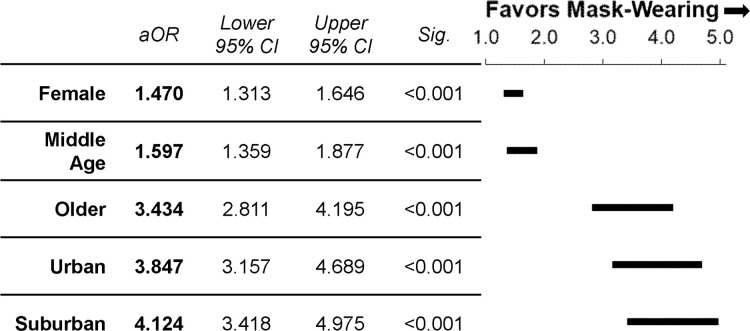
Fig 3. Odds of wearing a mask.
Adjusted odds ratios (aOR) and 95% confidence interval plots of mask usage for gender expression, age, and location during the initial data collection period from June 3rd-9th, 2020. Odds ratios are expressed in relation to reference groups (gender: male; age: young; location: rural).

