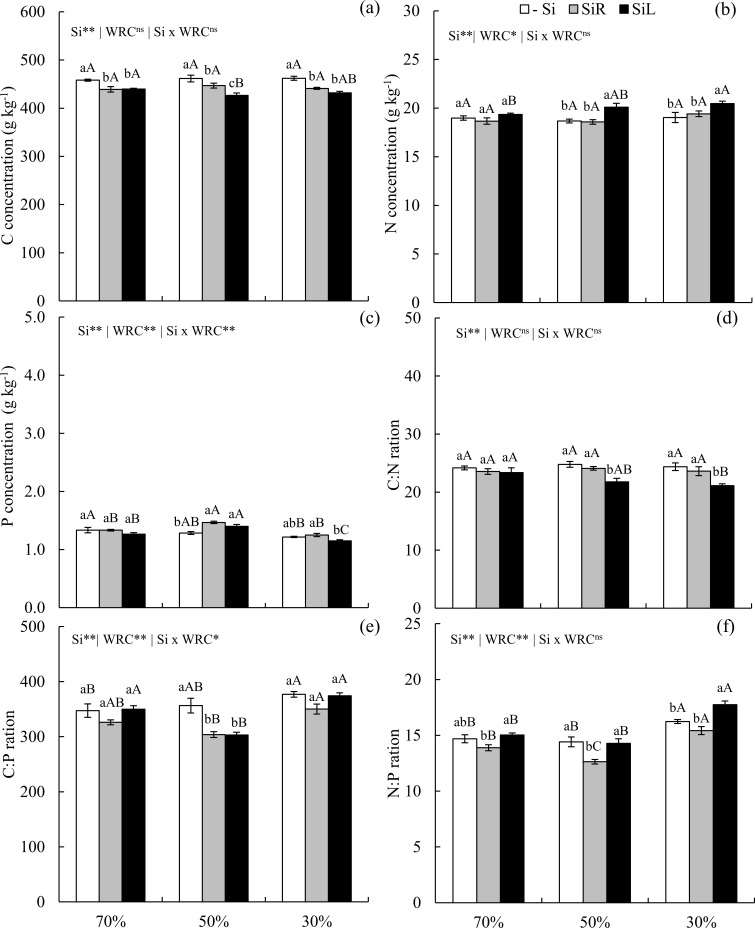
Fig 9.
Concentrations of C (a), N (b), and P (c), ratios C: N (d), C: P (e) and N: P (f) in pre-sprouted sugarcane seedlings under three soil water retention capacity (WRC) levels (70, 50, and 30%) and three forms of Si supply (Si via nutrient solution [SiR], Si via foliar spraying [SiL], and Si absence [−Si]). ** and *: significant at 1 and 5% probability, respectively; ns: non-significant by the F-test. Lowercase letters show differences in Si forms and uppercase letters in WRC levels by the Tukey’s test. Bars represent the standard error of the mean; n = 6.

