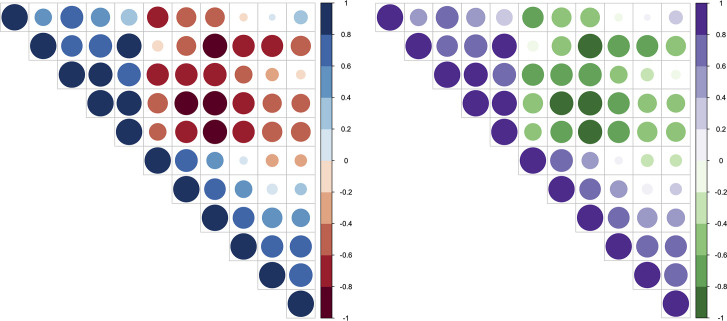
Fig 5. Example of correlation matrix plot with upper triangle.
Color intensity and the size of the circle are proportional to the correlation coefficients. Left: Chromatic aberration with the red/blue color combination. Negative/positive correlations: red/blue. Right: Improved data vis with the green/purple complementary color combination. Negative/positive correlations: green/purple.

