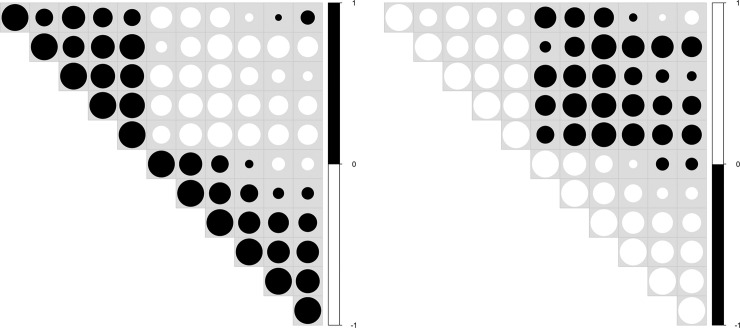
Fig 10. Example of upper triangle adapted from the correlation matrix in Fig 2.
Only the size of the circle is proportional to the correlation coefficients. The background is shown in light gray; otherwise, white circles are not visible. Positive/negative correlations are color coded, either in black/white (left) or in white/black (right). Depending on the story we want to convey, the visual importance of positive or negative correlations can be emphasized using black. To limit the focus on 1 specific range of the data, it is also possible to either color code 1 correlation type using a gray scale palette. Since the color of some gray circles may coincide with the background color, one should be aware of such an influence on the audience's perception.

