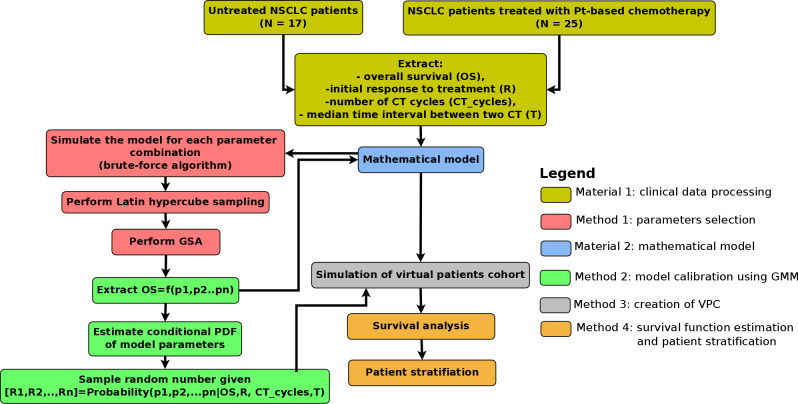
Fig 1. Computational framework.
The diagram shows the flowchart of the computation. In the first step, the clinical data from NH and CT cohorts are merged. Next, the data are applied to estimate the probability density function (PDF) of CTcycles and T using Gaussian mixture model (GMM). In the next step, joint PDF, P(DT,σ|OS) is estimated using a combination of brute-force algorithm and GMM. The second and third steps provide the possibility to create virtual patients (VPs), who are then simulated from diagnosis until clinical death. In the last step, Kaplan-Meier analysis is performed and patients are stratified. The details of the computational framework are presented in the Materials and Methods section as well as in the Supplementary Text.

