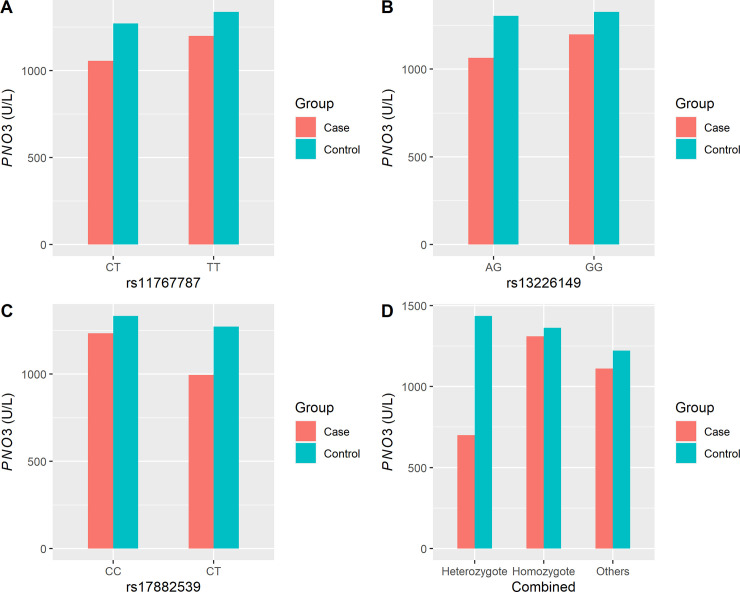
Fig 3. Distributions of plasma PNO3 activity in the ONID and control groups for rs11767787, rs13226149 and rs17882539, and combined, respectively.
Red bars represent control group and blue bars represent ONID cases. The genotypes are indicated below each bar chart. A showed PON3 activity at rs11767787, B showed PON3 activity at rs13226149, C showed PON3 activity at rs17882539, and D showed PON3 activity at three SNPs combined.

