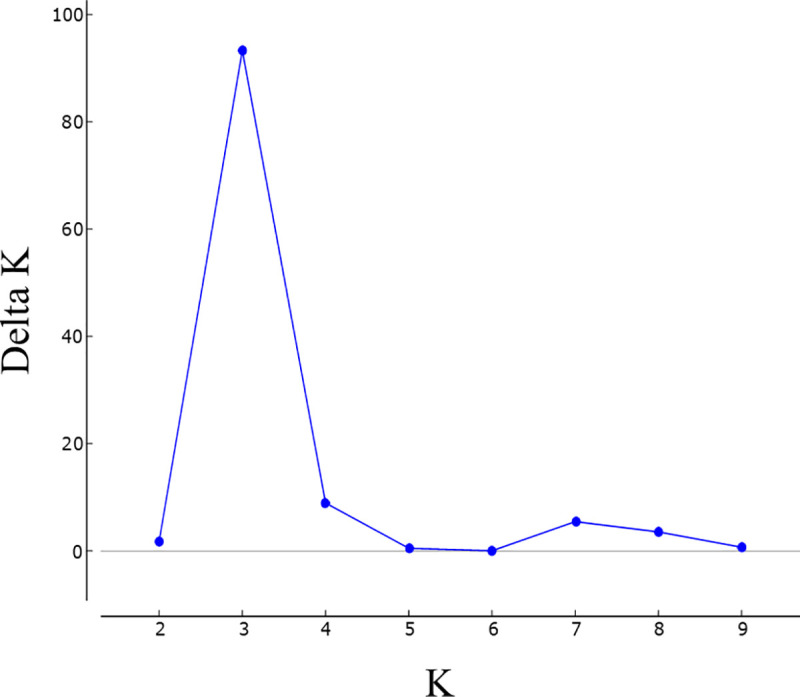
Fig 1. STRUCTURE Harvester results.

The most probable number of genetic clusters (K) within the full data set of 410 individuals based on the method described by Evanno et al. (2005) [51]. Delta K graph determined the maximum value at K = 3.

The most probable number of genetic clusters (K) within the full data set of 410 individuals based on the method described by Evanno et al. (2005) [51]. Delta K graph determined the maximum value at K = 3.