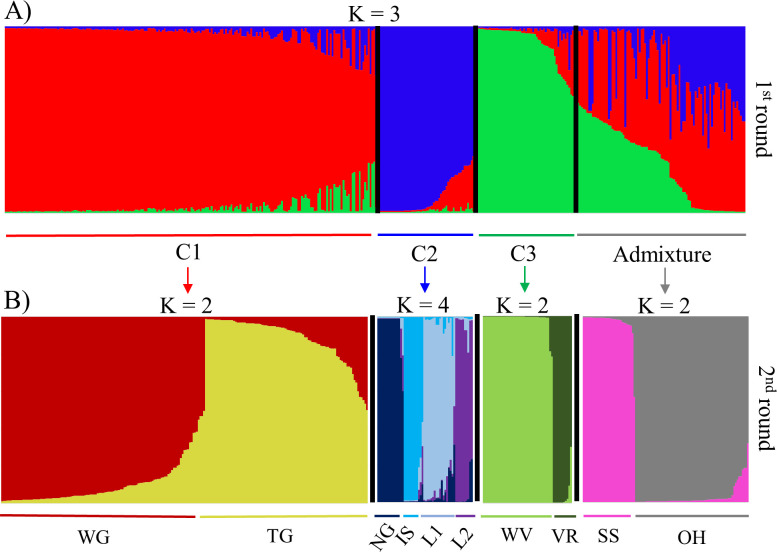
Fig 2. Genetic structure of the Vitis germplasm accessions obtained on the basis of 17 microsatellite markers.
Bar graphs of the estimated membership proportions (q) for each of the 410 accessions. Each accession is represented by a single vertical line, which is partitioned into colored segments in proportion to the estimated membership in each cluster. (A) First round of STRUCTURE analysis, inferred genetic structure for K = 3. Cluster 1 (C1): genetic predominance of the species V. vinifera; cluster 2 (C2): genetic predominance of the species V. labrusca; cluster 3 (C3): genetic predominance of wild Vitis species; Admixture: interspecific hybrids with a membership of q < 0.70. (B) Second round of STRUCTURE analysis. WG: wine grape accessions related to V. vinifera; TG: table grape accessions related to V. vinifera; NG: ‘Niagara’ accessions; IS: ‘Ives’ and ‘Isabella’ accessions; L1 and L2: Others V. labrusca hybrids; WV: accessions related to wild Vitis species; VR: V. rotundifolia accessions; SS: accessions related to the Seibel series; OH: complex interspecific hybrids.

