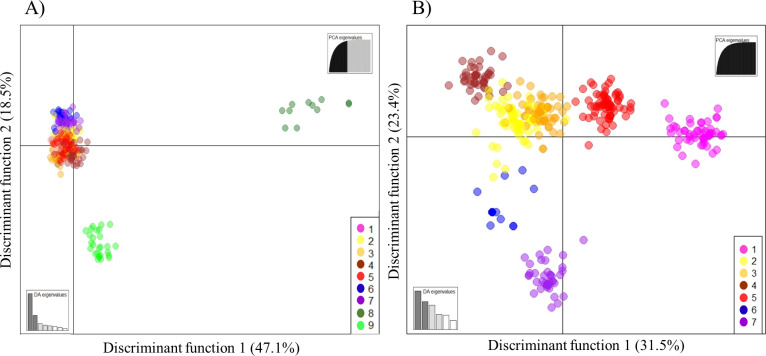
Fig 4. DAPC scatterplots based on the K-means algorithm used to identify the proper number of clusters.
Dots represent individuals, and the clusters are presented in different colors. The accessions were allocated into nine clusters: 1 (magenta), related to the Seibel series; 2 (yellow), related to table grape accessions of V. vinifera; 3 (orange) and 5 (red), related to wine grape accessions of V. vinifera; 4 (brown), predominance of IAC hybrids; 6 (blue) and 7 (purple), related to the species V. labrusca; 8 (dark green), related to wild Vitis species; and 9 (green), V. rotundifolia accessions. (A) DAPC with all samples included. (B) DAPC excluding clusters 8 and 9.

