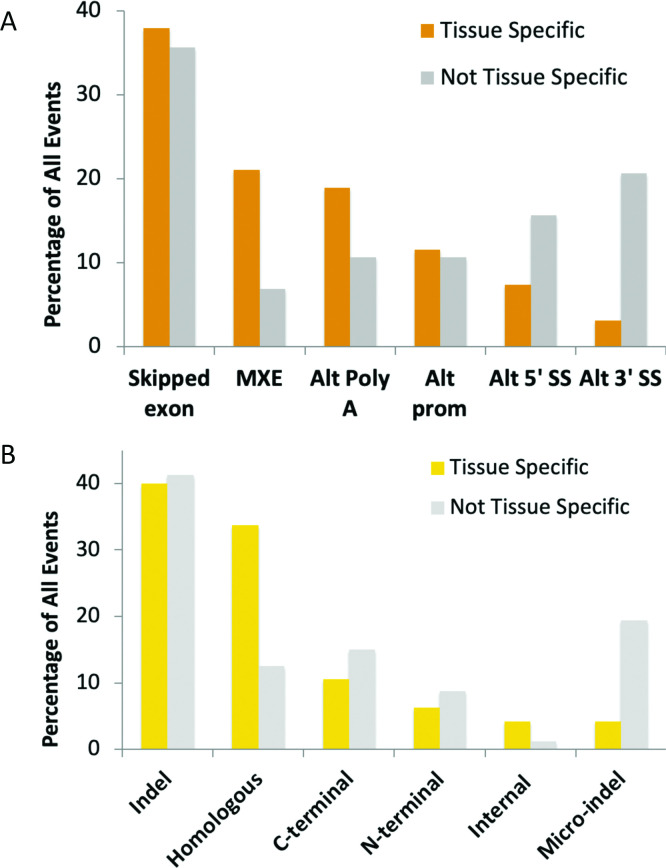
Fig 2. Tissue-specific expression at the proteomics level by type of splice event.
(A) The breakdown of events by alternative splicing mechanism and tissue specificity, or lack of. The proportion of the 95 events that are tissue or group specific events are in orange. The proportions of event types among the 160 non-tissue specific events are shown in grey. (B) The relative proportions of tissue specificity of different protein level events. The proportion of the 95 tissue or group specific events that make up each event type is shown in yellow. The proportions of event types among the 160 non-tissue specific events are shown in light blue. All event types are defined in the main text.

