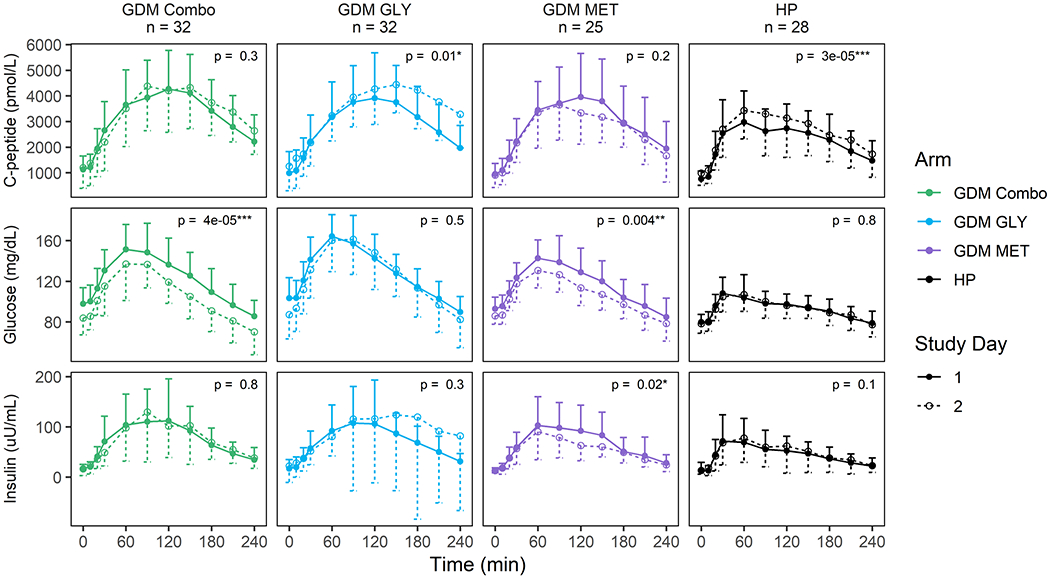
Figure 1. Glucose, insulin and C-peptide concentration-time profiles for all subjects with gestational diabetes mellitus (GDM) and healthy pregnant subjects who completed the study and were adherent to study procedures.

Shown are mean concentrations at each time point with the standard deviation represented by unidirectional error bars. Time since initiation of the MMTT and dose in minutes is listed on the x axis and the concentration of C-peptide (pmol/L), glucose (mg/dL), or insulin (μU/mL) is on the y axis. Data for SD1 are shown with filled circles (means), solid lines, and upper error bars (standard deviation); data for SD2 are shown with open circles, dashed lines, and lower error bars. Treatment arms are represented by COMBO = metformin/glyburide combination therapy group (green), MET = metformin monotherapy group (purple), GLY = glyburide monotherapy group (blue) and HP = healthy pregnancy group (black). Significance is indicated by asterisks.
