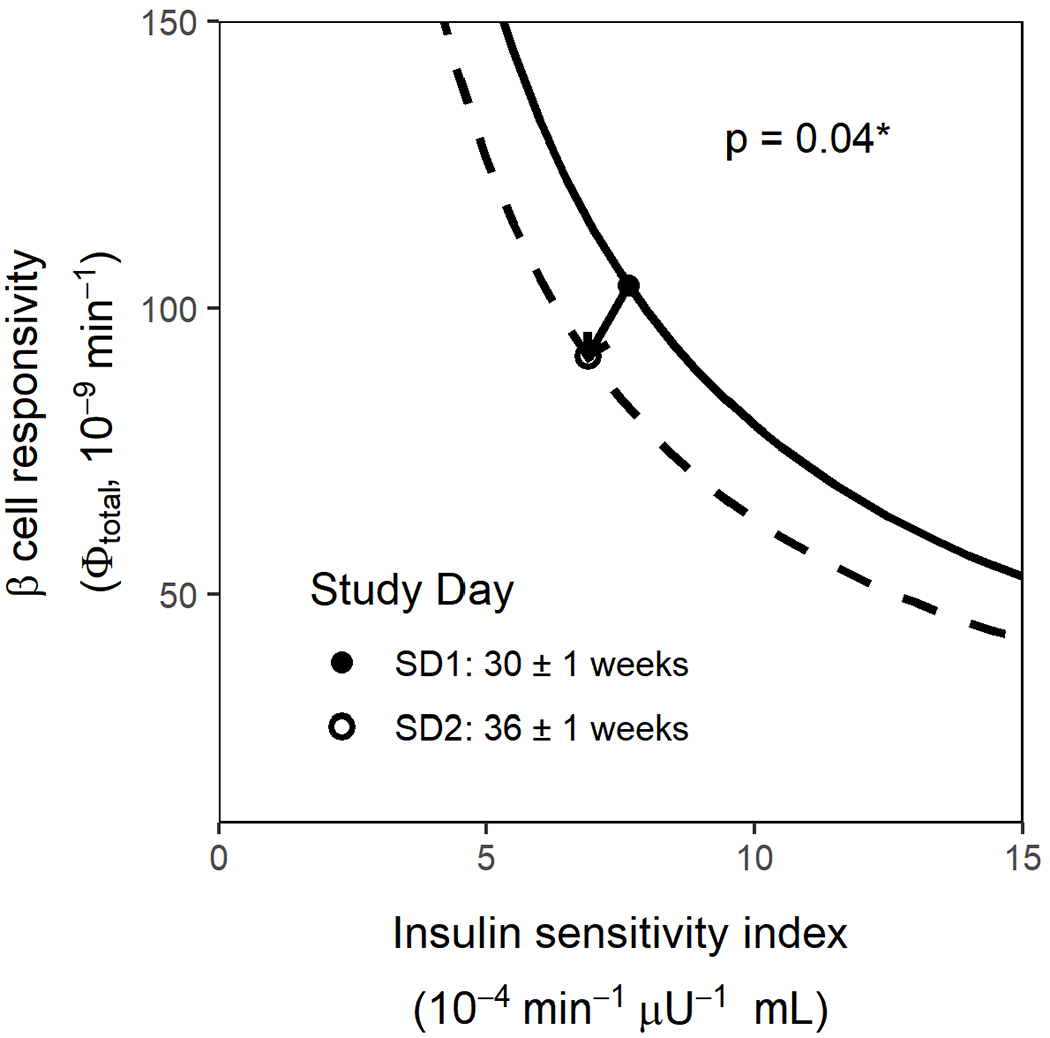
Figure 2. Effect of gestational age on the mean disposition index in healthy pregnant subjects.

Only paired data for healthy pregnant subjects who completed study day 1 (SD1) and study day 2 (SD2) are included (n=28). Insulin sensitivity is depicted on the x axis, and total β cell responsivity is depicted on the y, and points depict the mean total β-cell responsivity and mean SI on SD1 (filled circle) and SD2 (open circle) for the HP group. The hyperbolas shown depict the calculated total β-cell responsivity given the range of SI values shown for HP on SD1 (solid line) and SD2 (dashed line) where total β-cell responsivity and the DI value used was the mean total β-cell responsivity times the mean SI.
