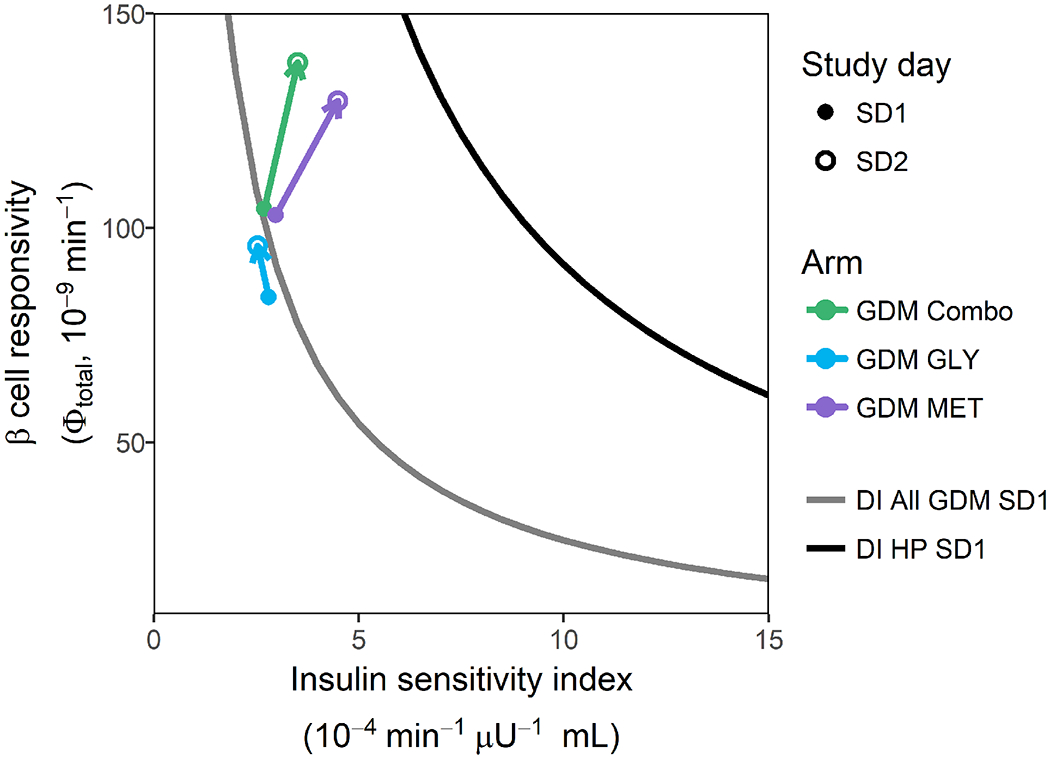
Figure 3. Pharmacodynamic effects of GLY, MET and GLY/MET Combo therapies.

Gray line depicts the mean baseline disposition index for all adherent subjects with GDM who completed the study. The black line depicts the mean baseline disposition index for all healthy pregnant subjects who completed the study. The vectors depict the mean pharmacodynamic effect of GLY (blue arrow), MET (purple arrow) and GLY/MET combination therapy (green arrow). Solid dots represent mean baseline disposition index (study day 1) and open circles represent study day 2 mean disposition index adjusted for mean gestational age-dependent change.
