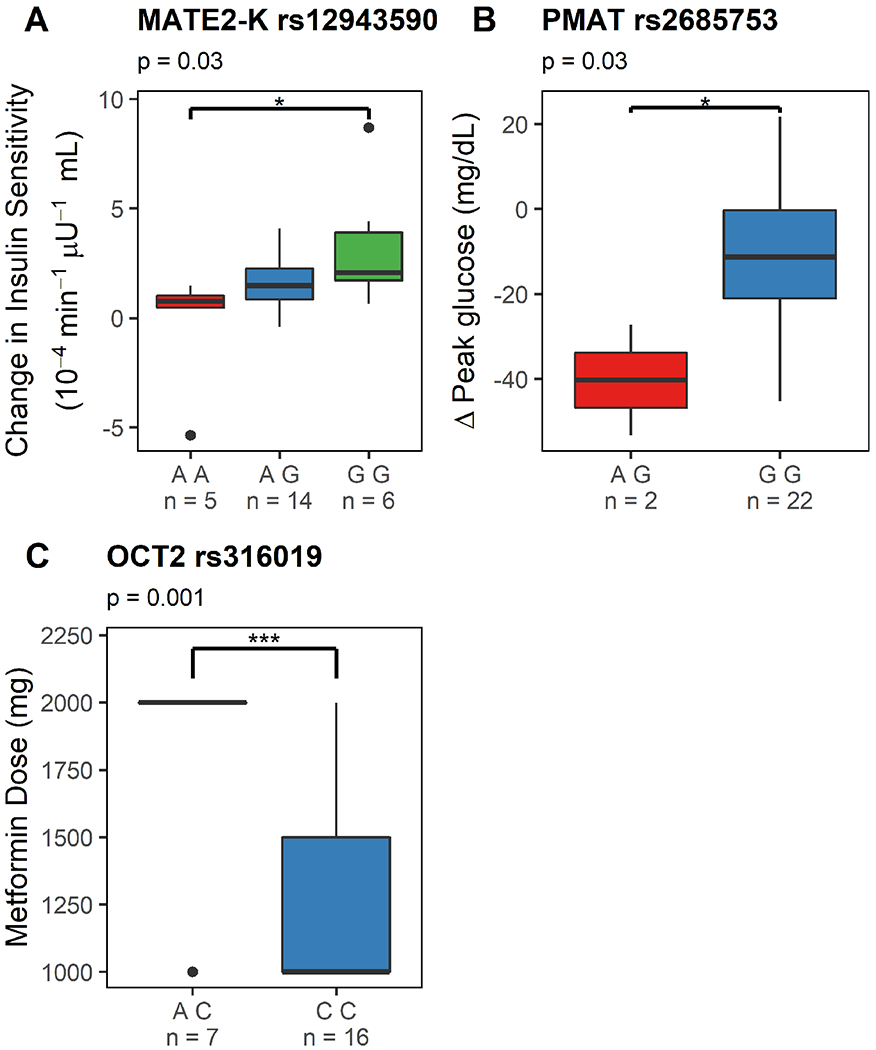
Figure 4. Effects of a splice variant of multidrug and toxin extrusion transporter 2 (MATE2-K) and organic cation transporter 2 (OCT2) genotype on metformin response and dose in women with GDM who were adherent and completed the study.

Figure 4A depicts a Tukey boxplot of the effects of MATE2-K genotype (rs12943590; AA, AG and GG) on metformin pharmacologic activity (i.e. change in insulin sensitivity between study day 1 and study day 2, adjusted for gestational age dependent changes) in women receiving metformin monotherapy. Figure 4B depicts a Tukey boxplot of the effects of PMAT genotype (rs2685753; AG and GG) on change in peak glucose concentrations in women receiving metformin monotherapy. Figure 4C depicts a Tukey boxplot of the effects of OCT2 genotype (rs316019, AC vs CC) on metformin dose on study day 2 in women receiving metformin monotherapy. *: p<0.05, **: p<0.01 and ***: p<0.001.
