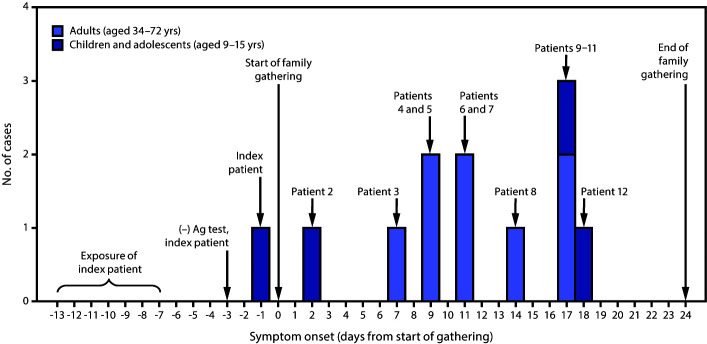
FIGURE.
COVID-19 cases among children, adolescents, and adults who attended a 3-week family gathering* — four states, June–July 2020
Abbreviations: Ag = antigen; COVID-19 = coronavirus disease 2019.
* Patient numbers refer to those in the Table, where further details about each patient are provided.

