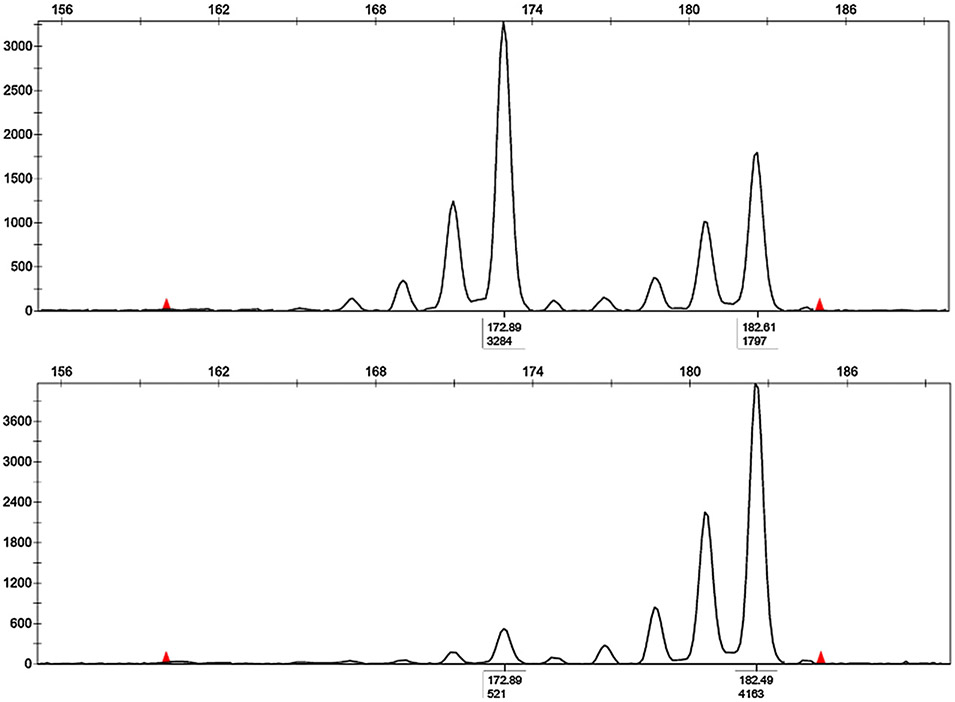
Fig. 3.
Representative figure of semi-automated assessment of LOH using the D3S1597 marker. The peak heights in fluorescent units are shown on the Y-axis on the left. A, Amplification from normal adjacent renal parenchyma cells demonstrating two alleles. B, An example of a complete allele deletion (LOH) in tumor cells from the same patient. Tumor cells demonstrate only the second allele. LOH was calculated by comparison of the allele ratio of normal cells with the allele ratio in tumor cells (521/3284). The criterion for LOH was at least a 60% reduction of the lesional allele, with the subsequent modification of the allele ratio.

