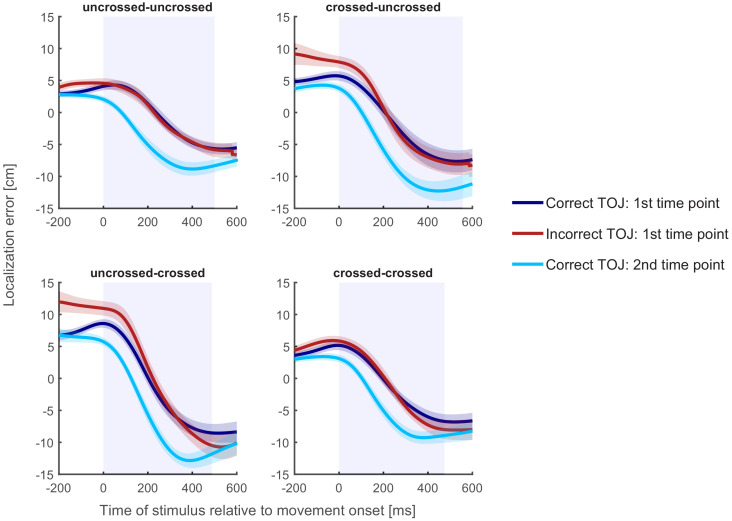
Figure 5. Localization curves, averaged across participants, for each of the four posture conditions in Experiment 1.
Curves of incorrect TOJ trials (red) show a similar pattern as the localization curves of the correct TOJ trials at time 1 (dark blue), but not as the localization curves of the correct TOJ trials at time 2 (light blue). Traces reflect the mean localization error, shaded areas around the traces reflect s.e.m. across participants. The shaded regions in the background represent the average movement time.

