. 2020 Sep 18;9:e57804. doi: 10.7554/eLife.57804

Figure 7. Localization curves, averaged across participants and posture, for each of the four SOAs in Experiment 2.

Curves of incorrect TOJ trials (red) show a similar pattern as the localization curves of the correct TOJ trials at time 1 (dark blue), but not as the localization curves of the correct TOJ trials at time 2 (light blue). This pattern was highly similar across all participants and also when calculated separately for each posture condition (see Supplementary Information). Traces reflect the mean, shaded areas around the traces reflect s.e.m. The shaded regions in the background represent the average movement time.

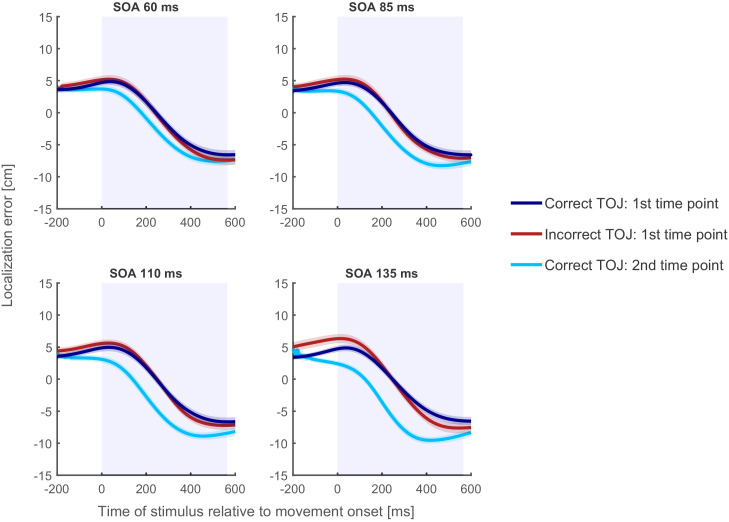
Figure 7.

Figure 7—figure supplement 1. TOJ performance of Experiment 2.

Figure 7—figure supplement 1.

Proportion of correct hand assignment across movement conditions (uncrossed-uncrossed, crossed-crossed) and SOA (60, 85, 110, 135 ms) in Experiment 2. Error bars denote 2 s.e. from the mean; asymmetry is due to nonlinear conversion from the GLMM’s logit scale to percentage correct. Large symbols are group means, small symbols are individual participants’ performance. TOJ performance in Experiment 2 was modulated by hand posture and SOA. A GLMM with factors posture (uncrossed-uncrossed, crossed-crossed) and SOA (60, 85, 110, 135 ms) revealed significant main effects of posture (χ2(8,9)=586.94, p<0.001) and SOA (χ2(6,9)=218.00, p<0.001), and a significant interaction (χ2(6,9)=66.63, p<0.001). Post hoc analysis of the interaction (Bonferroni corrected, see in Supplementary file 1) showed that TOJ performance was better when the arms were in an uncrossed compared to a crossed posture at all SOAs. Furthermore, performance increased with SOA duration for the uncrossed posture but was relatively similar across all SOAs for the crossed posture.
Figure 7—figure supplement 2. Localization performance in the uncrossed-uncrossed condition of Experiment 2.

Figure 7—figure supplement 2.

Localization error curves of the uncrossed-uncrossed posture condition, averaged across participants, for each of the four SOAs in Experiment 2. Curves of incorrect TOJ trials (red) show a similar pattern as the localization curves of the correct TOJ trials at time 1 (dark blue), but not as the localization curves of the correct TOJ trials at time 2 (light blue). Traces reflect the mean, shaded areas around the traces reflect s.e.m. The shaded regions in the background represent the average movement time.
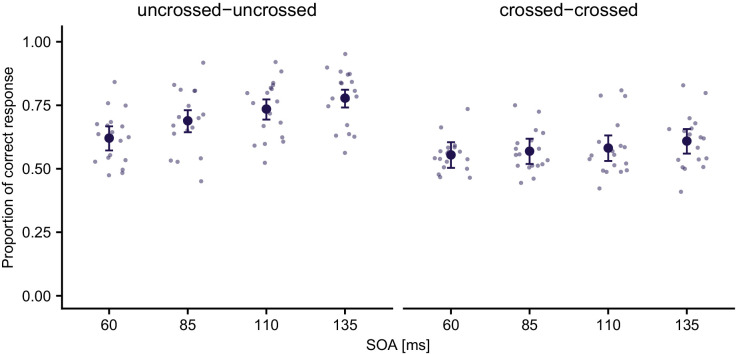
Figure 7—figure supplement 3. Localization performance in the crossed-crossed condition of Experiment 2.

Figure 7—figure supplement 3.

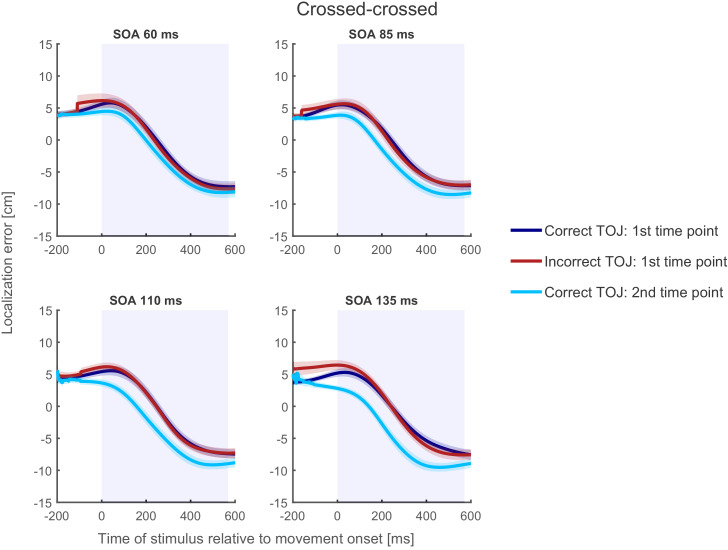
Localization error curves of the crossed-crossed posture condition, averaged across participants, for each of the four SOAs in Experiment 2. Curves of incorrect TOJ trials (red) show a similar pattern as the localization curves of the correct TOJ trials at time 1 (dark blue), but not as the localization curves of the correct TOJ trials at time 2 (light blue). Traces reflect the mean, shaded areas around the traces reflect s.e.m. The shaded regions in the background represent the average movement time.
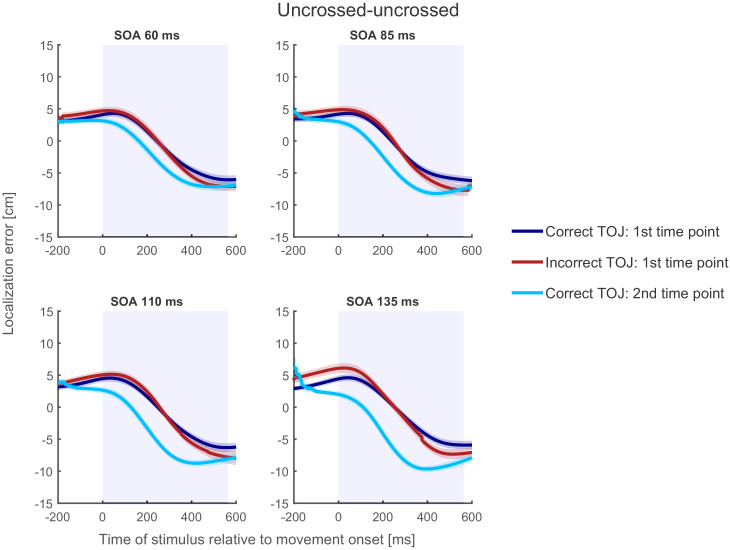
Figure 7—figure supplement 4. Single participant example of localization performance in Experiment 2.

Figure 7—figure supplement 4.

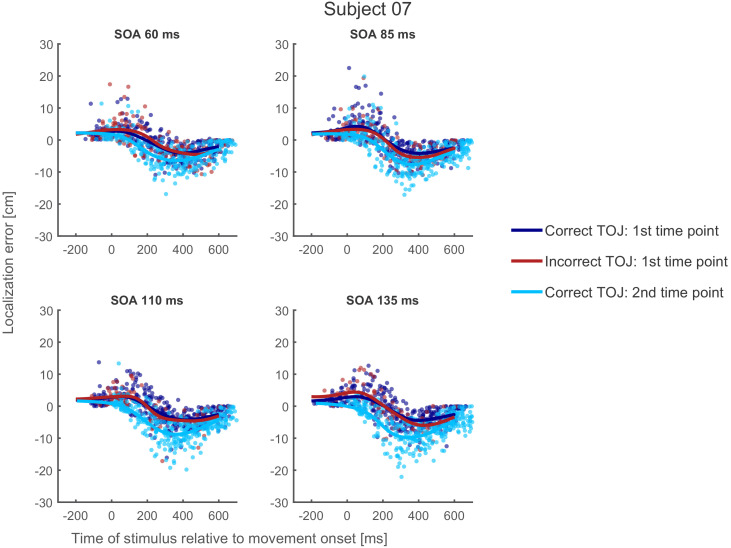
Localization error curves of a representative participant (#07), averaged across posture, for each of the four SOAs in Experiment 2. Curves of incorrect TOJ trials (red) show a similar pattern as the localization curves of the correct TOJ trials at time 1 (dark blue), but not as the localization curves of the correct TOJ trials at time 2 (light blue).