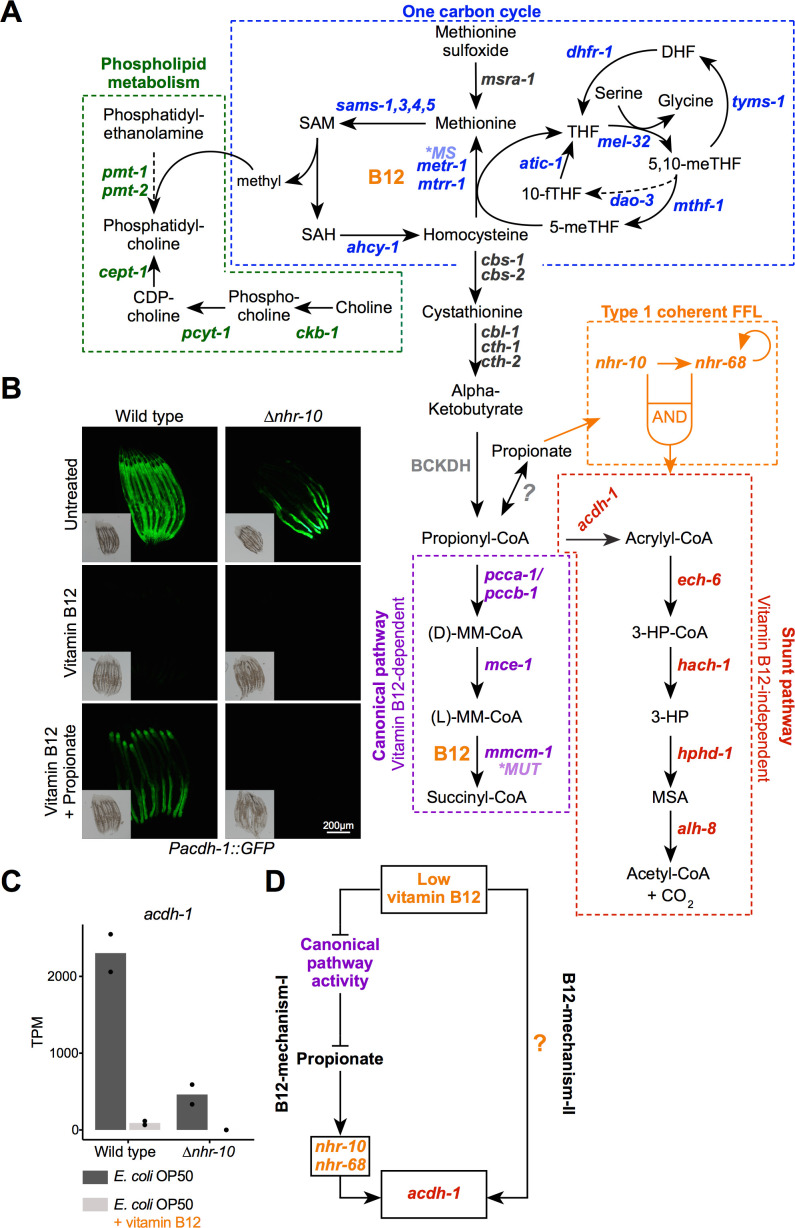
Figure 1. Two mechanisms of gene regulation by low vitamin B12 dietary conditions.
(A) Cartoon of vitamin B12-related metabolic pathways in C. elegans. CDP –cytidine 5’-diphosphocholine; DHF – dihydrofolate; 3-HP – 3-hydroxypropionate; 5,10-meTHF – 5,10-methylenetetrahydrofolate; 5-meTHF – 5-methyltetrahydrofolate; 10-fTFH –10-formyltetrahydrofolate; BCKDH – branched-chain α-ketoacid dehydrogenase complex; MM-CoA – methylmalonyl-coenzyme A; *MUT – human methylmalonyl-coenzyme A mutase; *MS – human methionine synthase; MSA – malonic semialdehyde; SAH – S-adenosylhomocysteine; SAM – S-adenosylmethionine; THF – tetrahydrofolate; FFL – feed forward loop. Dashed arrows indicate multiple reaction steps. (B) Fluorescence microscopy images of Pacdh-1::GFP reporter animals in wild type and ∆nhr-10 mutant background with different supplements as indicated. Insets show brightfield images. (C) RNA-seq data of acdh-1 mRNA with and without 20 nM vitamin B12 in wild type and ∆nhr-10 mutant animals (Bulcha et al., 2019). Datapoints show each biological replicate and the bar represents the mean. TPM – transcripts per million. p adjusted values are provided in Supplementary file 1. (D) Cartoon illustrating two mechanisms of gene regulation by low vitamin B12 dietary conditions.
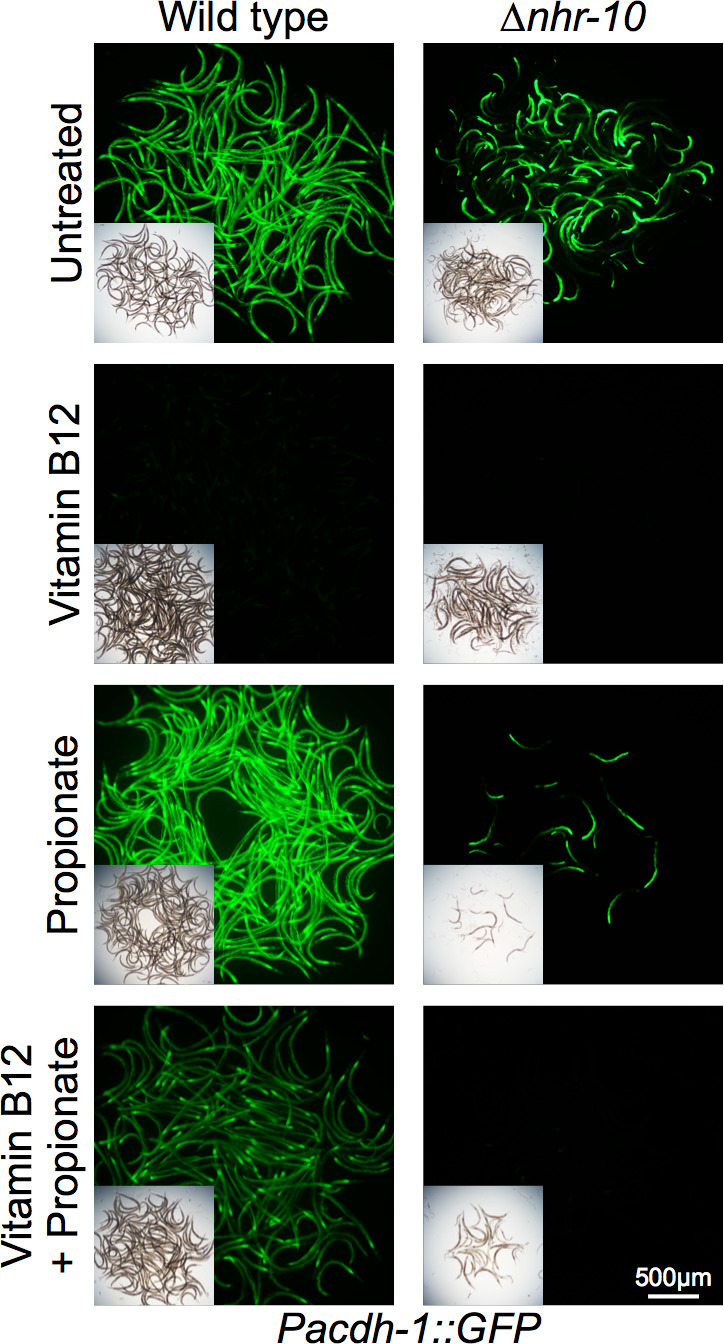
Figure 1—figure supplement 1. Fluorescent microscopy images of Pacdh-1::GFP animals in wild type and ∆nhr-10 mutant backgrounds with supplemented metabolites as indicated.


