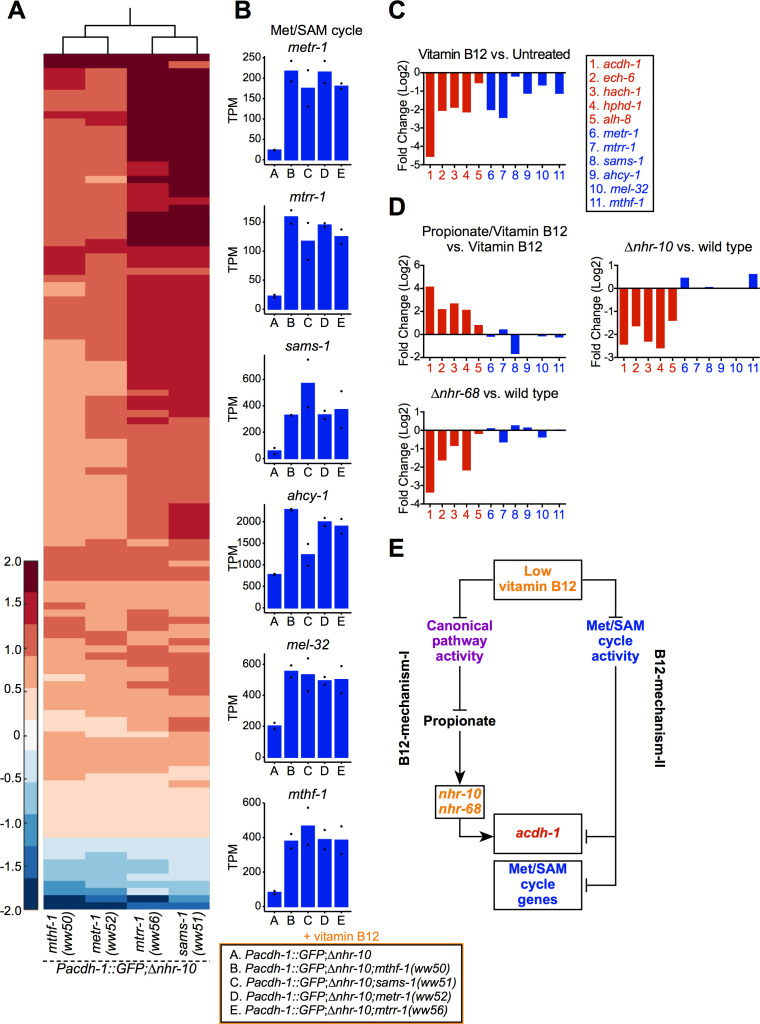
Figure 3. Genetic mutations in Met/SAM cycle genes activate Met/SAM cycle gene expression.
(A) Hierarchal clustering of log10-transformed fold change RNA-seq data. Changes are relative to the Pacdh-1::GFP;∆nhr-10 parent strain with the cutoffs of a fold change of 1.5 and a p adjusted value less than 0.01. Only genes that change in expression in all four Met/SAM cycle gene mutants are shown. (B) Bar graphs of Met/SAM cycle gene expression by RNA-seq in the four Met/SAM cycle mutants and in the Pacdh-1::GFP;∆nhr-10 parent strain. Datapoints show each biological replicate and the bar represents the mean. TPM – transcripts per million. p adjusted values are provided in Supplementary file 2. (C) RNA-seq comparison of Met/SAM cycle (blue) and propionate shunt (red) gene expression in response to 20 nM vitamin B12. Bar represents the mean of two biological replicates. p adjusted values are provided in Supplementary file 1. (D) Comparison of Met/SAM cycle and propionate shunt genes in response to 20 nM vitamin B12 plus 40 mM propionate or in nhr-10 and nhr-68 mutant animals. Bar represents the mean of two biological replicates. p adjusted values are provided in Supplementary file 1. (E) Cartoon illustrating met/SAM cycle gene activation in response to B12-mechanism-II.

