
Figure 2. HCN1-labeled basket cell pinceaux are smaller in zebrinII-positive zones and larger in zebrinII-negative Purkinje cell zones.
(A, C, E) Coronal sections cut through the cerebellar cortex showing zebrinII (green, PC) and HCN1 (red, pinceau) expression. Dotted lines delineate the Purkinje cell zonal boundaries. Purkinje cell bodies are contained within the Purkinje cell layer (PCL) underneath the molecular layer (ML), and basket cell pinceaux are located in the superficial granular layer (GL) and PCL. (B, D, F) Magnified image of a zebrinII zonal boundary from panel A, C, and E, respectively (left, zebrinII-negative; right, zebrinII-positive). (E,F) Merged zebrinII and HCN1 expression patterns from A–D. Scale bars are 100 μm and 30 μm, respectively. Brackets in F highlight the pinceau size difference across a zebrinII Purkinje cell zonal boundary. (G) Schematic depiction of pinceau size distinctions in zebrinII-positive and -negative zones. (H) Whole-mount schematic diagram of the cerebellum showing the zebrinII expression pattern in lobule VIII. ZebrinII-positive zones in green are marked as P1+, P2+, and P3+ using the standard zebrinII zone nomenclature (see Sillitoe and Hawkes, 2002). (I) Quantification of pinceau area across zebrinII Purkinje cell zones in C57BL/6J mice reveals significantly smaller total pinceau size in zebrinII-positive zones (mean = 131.4 µm², SD = 44.76 µm²) compared to negative zones (mean = 383.5 µm², SD = 87.19 µm²). Each data point indicates the total area of multiple HCN1-labeled pinceaux within a 100 μm-wide region of a zebrinII-positive or -negative Purkinje cell zone, reported in µm² (N = 6, n = 12 sections, 26 zebrinII-positive Purkinje cell zones and 26 zebrinII-negative Purkinje cell zones; ****p<0.0001). (J) Corrected total cell fluorescence (CTCF) analysis reveals no significant difference in HCN1-labeled pinceau fluorescence intensity between pinceaux associated with zebrinII-positive (mean = 73.9, SD = 3.3) and zebrinII-negative (mean = 73.41, SD = 3.55) Purkinje cells. Each data point represents the CTCF value of a 1 µm² region in a single pinceau (N = 6 mice, n = 12 large and 12 small pinceaux; p>0.05; note, however, that although six mice were used for the quantitative analysis, the patterned relationship between HCN1 and zebrinII was consistently observed in every mouse studied so far, N > 20).

Figure 2—figure supplement 1. HCN1 expression reveals zones in the hemisphere lobules.
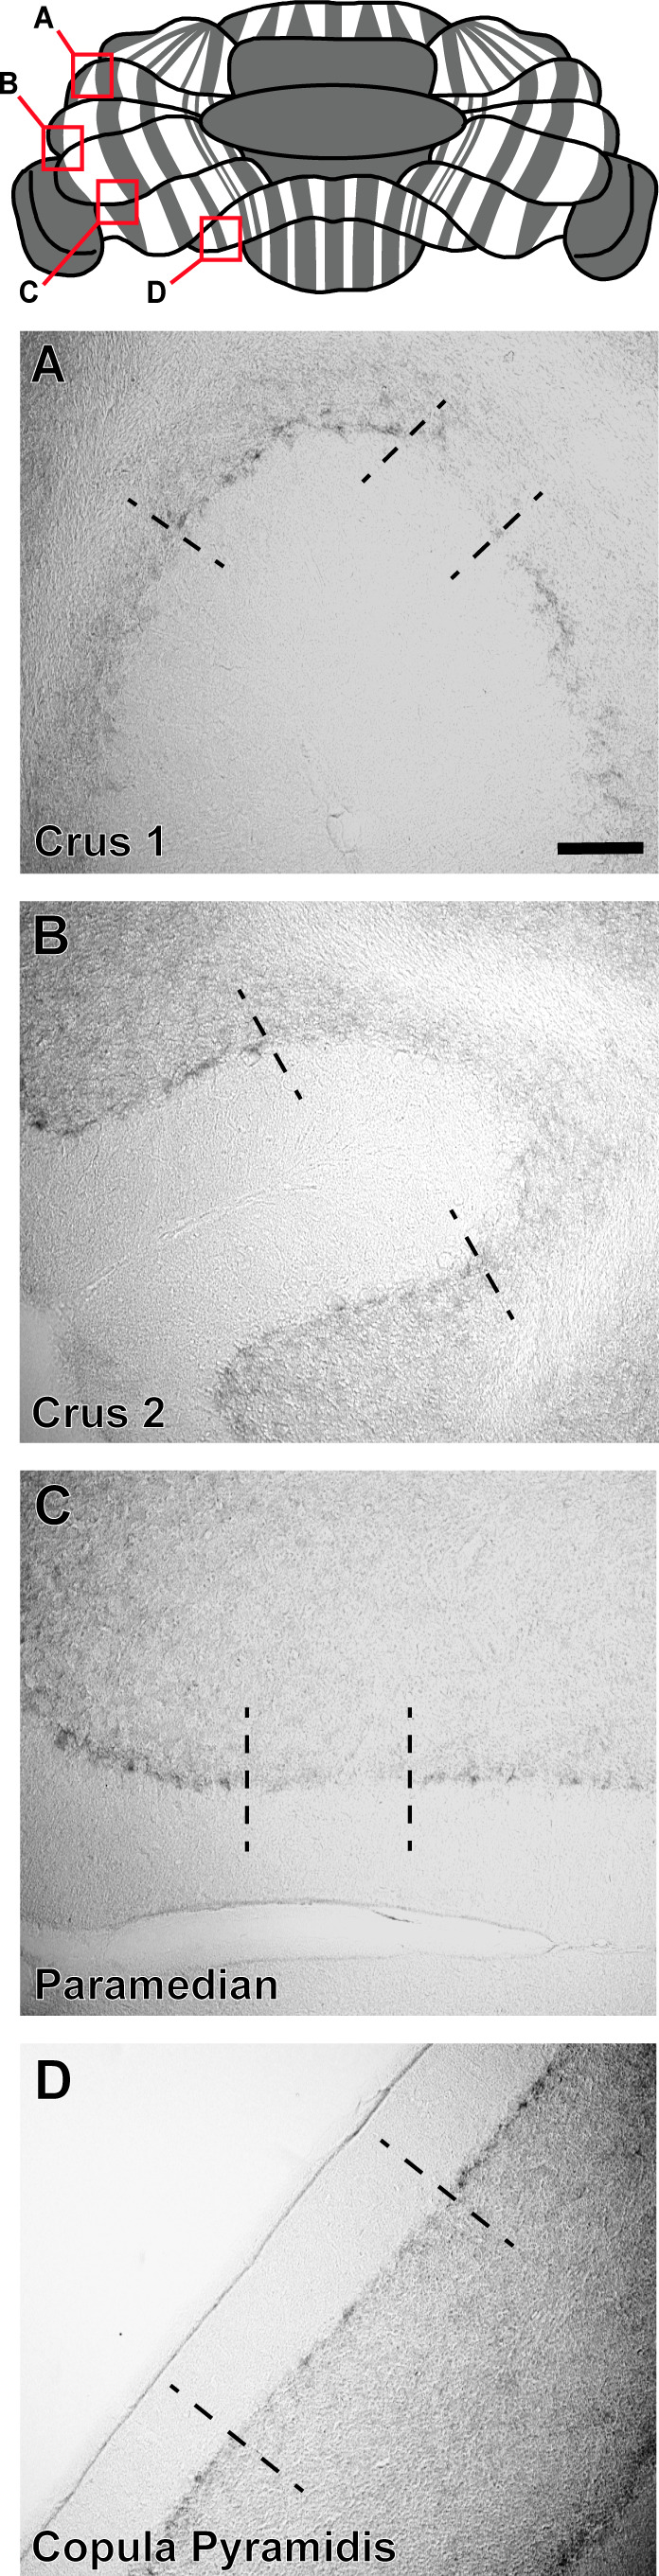
Figure 2—figure supplement 2. Sample antibody staining controls for the expression of protein markers in basket cell zones.
