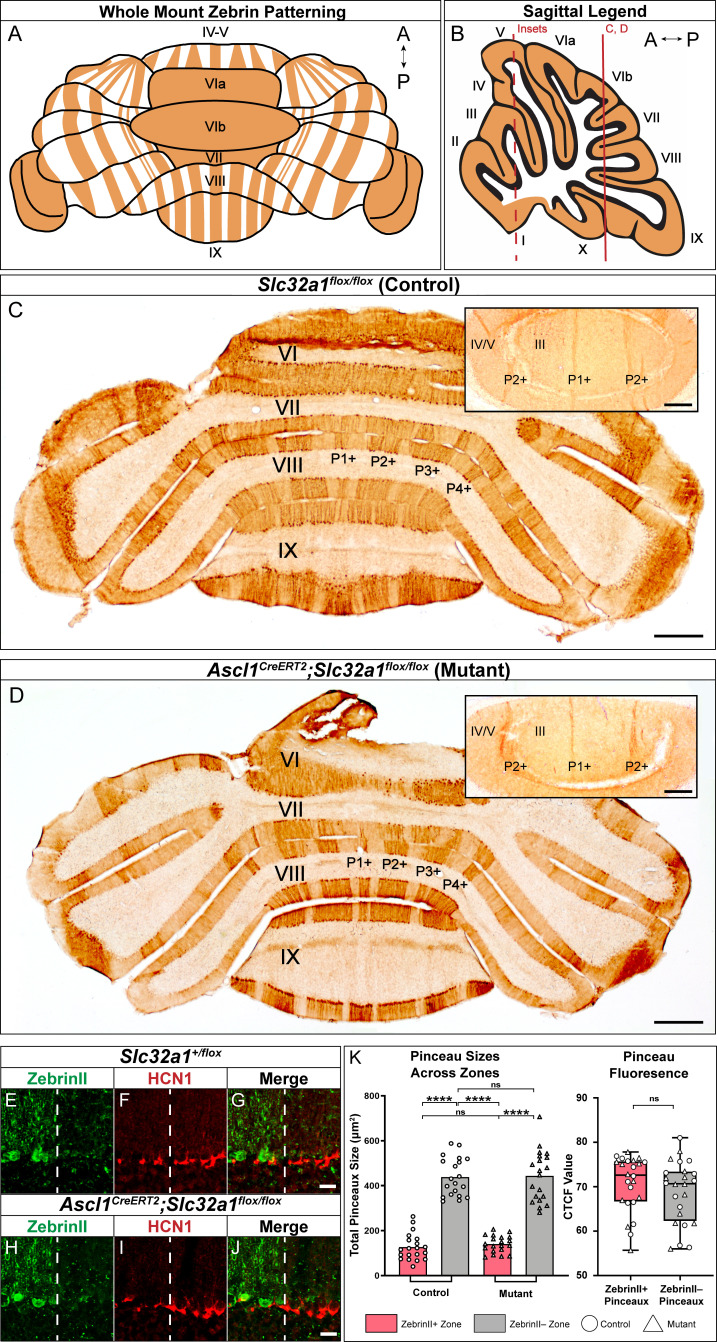
Figure 8. Silencing basket cell GABAergic inhibitory neurotransmission does not affect the zonal patterning of Purkinje cells.
(A) Schematic representation of normal zebrinII patterning across the whole mouse cerebellum, seen in a whole-mount configuration. (B) Sagittal schematic of a mouse cerebellum slice at the midline; the red vertical line indicates the anatomical location of the coronal sections shown in C and D. The red dotted line indicates the location of the cerebellum that the insets were acquired from. (C) Coronal section from a control mouse given tamoxifen at E18.5, stained to reveal normal zebrinII expression patterning (N = 4, scale bar is 500 μm). Because the Ascl1CreERT2 allele was not expressed in this animal, inhibitory neurotransmission of basket cells was not affected. Inset in the top right corner shows a higher power magnification image from lobules III and IV/V in the anterior cerebellum (scale bar is 250 μm), with normal zebrinII zonal patterning for that region of the cerebellum. Coronal-cut tissue section from a mouse expressing both the Ascl1CreERT2 and Slc32a1flox/flox alleles, given tamoxifen at E18.5 to target the silencing of neurotransmission in basket cells. Because both the Ascl1CreERT2 allele and the Slc32a1flox/flox allele, which is used to delete Slc32a1 with spatial and temporal control, were expressed in this animal, cerebellar basket cell neurotransmission was silenced throughout its lifetime. Despite this, staining in the anterior (top right inset), central and posterior lobules reveals that zebrinII patterning is unchanged in the absence of basket cell neurotransmission, as shown in D (N = 4). In lobules III and IV/V of the anterior cerebellum (inset), the ~500 µm distance between the P1+ and P2+ zebrinII zones (Sillitoe and Hawkes, 2002; Sillitoe et al., 2008b) and the sharpness of the zebrinII Purkinje cell zonal boundaries is maintained after GABAergic neurotransmission is genetically blocked at the basket cell terminals (scale bar is 250 µm). (E-G) Example immunohistochemistry for quantification of pinceaux size in a Slc32a1+/flox mouse. Scale = 25 µm. ZebrinII boundary = dotted line. (E) ZebrinII expression in Purkinje cells. (F) HCN1 expression in basket cell pinceaux. (G) ZebrinII and HCN1 merged image. (H-J) Example immunohistochemistry for quantification of pinceau size in an Ascl1CreERT2;Slc32a1flox/flox mouse. Scale = 25 µm. ZebrinII boundary = dotted line. (H) ZebrinII expression in Purkinje cells. (I) HCN1 expression in basket cell pinceaux. (J) ZebrinII and HCN1 merged image. (K) Left: Quantification of pinceau area across Purkinje cell zones reveals significantly smaller total pinceau size in zebrinII-positive zones compared to zebrinII-negative zones in both Slc32a1flox/flox controls (mean = 127.4 µm², SD = 59.25 µm² for zebrinII-positive zones; mean = 439.1 µm², SD = 85.34 µm² for zebrinII-negative zones; p<0.0001) and Ascl1CreERT2;Slc32a1flox/flox mutants (mean = 140.6 µm², SD = 37.73 µm² for zebrinII-positive zones; mean = 443.8 µm², SD = 113.3 µm² for zebrinII-negative zones; p<0.0001). Unlike the effects seen with silenced Purkinje cells as shown in Figure 7, silencing basket cells does not eliminate the size difference between pinceaux in zebrinII-positive and zebrinII-negative regions in the mutants. Each data point indicates the total area of the ROI covered by HCN1-labeled pinceaux within a 100 μm-wide region of a zebrinII-positive or -negative Purkinje cell zone, in µm². For control mice, N = 3, n = 4 sections, 20 zebrinII-positive Purkinje cell zones and 20 zebrinII-negative Purkinje cell zones. For mutants, N = 3 mice, n = 4 sections, 20 zebrinII-positive zones and 20 zebrinII-negative zones. Right: Corrected total cell fluorescence (CTCF) analysis reveals no significant difference in HCN1-labeled pinceau fluorescence intensity between pinceaux associated with zebrinII-positive (mean = 70.76, SD = 6.292) and zebrinII-negative (mean = 68.91, SD = 7.0) Purkinje cells, from both control and mutant animals. Each data point represents the CTCF value of a 1 µm² region in a single pinceau (N = 3 control and three mutant mice, n = 12 large and 12 small pinceaux per genotype; p>0.05).

