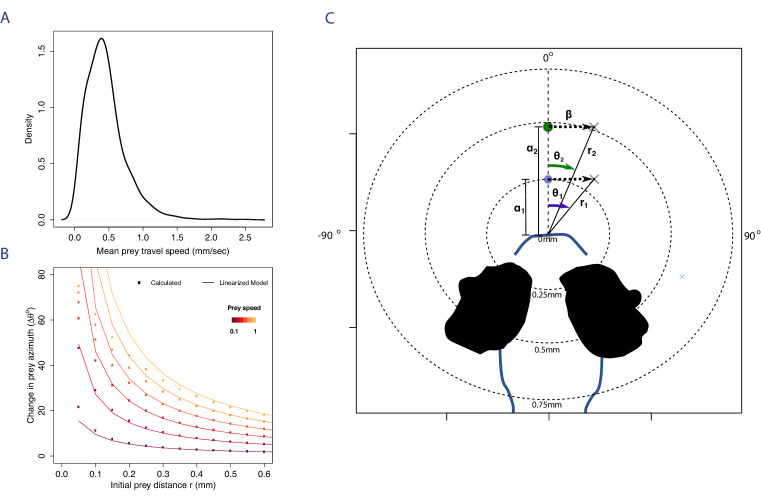
Appendix 5—figure 1. The aiming accuracy prior to a capture swim is strongly dependent on capture distance for the observed prey speeds.
(A) The distribution of mean prey travel speeds is estimated by measuring the total displacements per second from a random sample of videos each containing approximately freely swimming Rotifers. By analysing tracks of prey motion we estimated mean travel speeds by excluding track regions where prey is not moving (prey displacement is <0.05 mm/sec), and obtained the distribution of mean speeds using kernel density methods (BW = 0.1). This is a skewed distribution, with overall mean prey speed estimated at 0.46 (mm/sec) SE: 0.007, and maximum of 2.5 mm/sec. (B) To maintain prey azimuth within the range of observed in successful captures (ie., ±25°), assuming prey is moving at average speed (≈ 0.5 mm/sec), then capture distance needs to be >0.2 mm. This is shown by calculating the changes in θ (dots) between prey moving from initially in front of the larva at a distance , with (ie. ) to different positions during a typical interbout interval of 200 ms. The lines show how our linear approximation model, which uses the derivatives evaluated at position , r, capture the growth of with increasing prey displacement () and decreasing distance r. (C) Diagram showing how for prey moving at a fixed speed β the angular velocity of prey azimuth increases with distance from the larva. Thus, corrections to aiming prior to executing a capture swim become harder when the prey is closer, as they increase with (see text).

