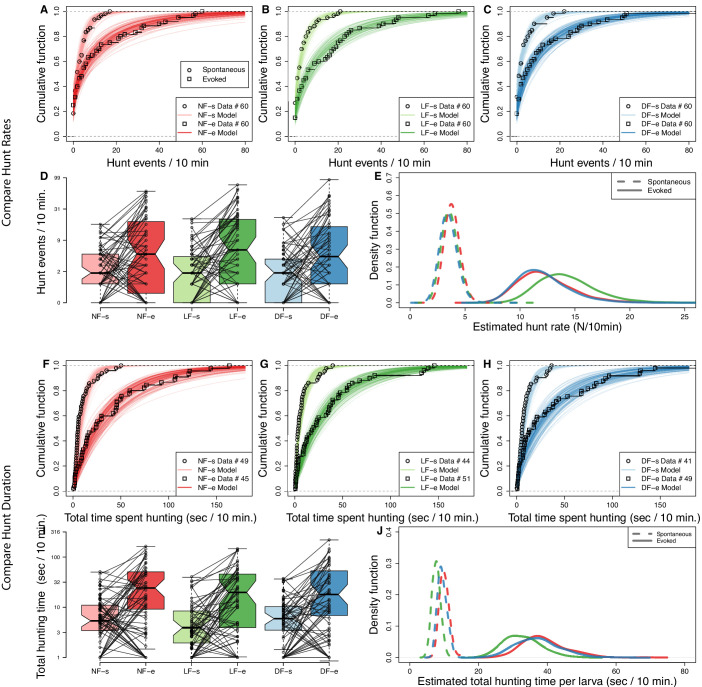
Figure 2. Experience increases hunt rate but decreases total time spent hunting.
Hunting effort of each group is characterized in terms of the distribution in number of hunt events and total hunting duration recorded from the 10 min behavioral recordings. The two test conditions, in the absence and in the presence of prey, are modeled separately to evaluate spontaneous (s) and evoked (e) hunt events, respectively. (A,B,C) Cumulative density function (CDF) of hunt event counts per larva (open squares) reveals that hunt-event frequency increases across groups once prey is added (NF, not-fed; DR, dry-fed; LF, live-fed). Lines indicate 200 cumulative density functions of negative binomial distributions, which have been inferred from hunt-frequency data. (D) Box plots showing number of hunt events per larvae indicate similar spontaneous and evoked counts in each feeding group. Connecting lines indicate that for most larvae the number of hunt events increases on addition of prey. (E) The distribution of estimated mean hunt-rate for each group, as inferred from the models’ parameters, confirms that hunt-rates increase from spontaneous (dotted lines) to evoked (solid lines) conditions. All groups (indicated by line color) show similar mean spontaneous hunt-rates (), with a somewhat higher rate observed in NF larvae (, ). In the presence of prey, however, LF larvae are more likely to exhibit higher hunt-rates than NF and DF larvae (). Overall, the mean estimated group hunt-rate (events/10 min.) in spontaneous/evoked conditions were , , . (F,G,H) Cumulative function plots showing the total time spent hunting under spontaneous and evoked conditions. Open squares show recorded data and lines indicate 200 cumulative density functions drawn from similar statistical model as in (A,B,C, see Materials and methods). All groups show an increase in total time spent hunting when prey is added. (I) Box plots showing the amount of time spent hunting increases from spontaneous to evoked test conditions for most larvae. (J) The estimated densities of mean hunt-duration of each group, as inferred from the model, clearly show that on average larvae spent more time hunting in evoked conditions (solid lines) than in spontaneous (dotted lines) conditions. Although DF and NF distributions look identical, the model reveals a noticeable shift towards shorter hunt durations () for LF larvae on average in both evoked and spontaneous conditions .


