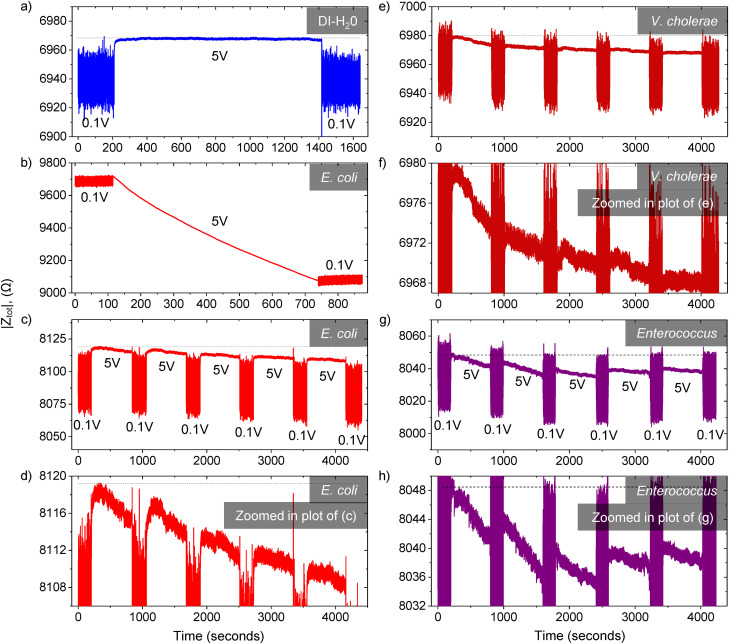
FIG. 4.
DEP impedance measurements. The applied DEP AC voltage of 5 Vpp and 0.1 Vpp represents the “ON” and “OFF” states, respectively. All experiments were carried out at a frequency of 5 MHz and a constant flow rate of 1 μl min−1 in DI-water as a suspension medium. (a) For DI-water only, the impedance response is flat as there was no deposition of E. coli bacteria, which represents the case where no bacteria are detected. (b) When the microchannel is infused with high concentration E. coli of 106 CFU ml−1, the absolute impedance decreased substantially. (c) The limit of detection of the device is tested with the 104 CFU ml−1 E. coli sample. The AC source voltage was applied in repeated blocks of “OFF”—200 s and “ON”—10 min. Due to the specific immobilization of E. coli bacteria through antibody–antigen reaction, the impedance continued to decrease gradually with time as more E. coli got trapped. (d) The zoomed in plot of the impedance response of subplot (c). (e) Bacteria detection test for the 103 CFU ml−1 Vibrio cholerae sample in a chip coated with Vibrio antibody. (f) Zoomed in plot of (e). (g) Bacteria detection test with ∼104 CFU ml−1 Enterococcus sample in chip coated with Enterococcus antibody, (h) Zoomed in plot of (g).

