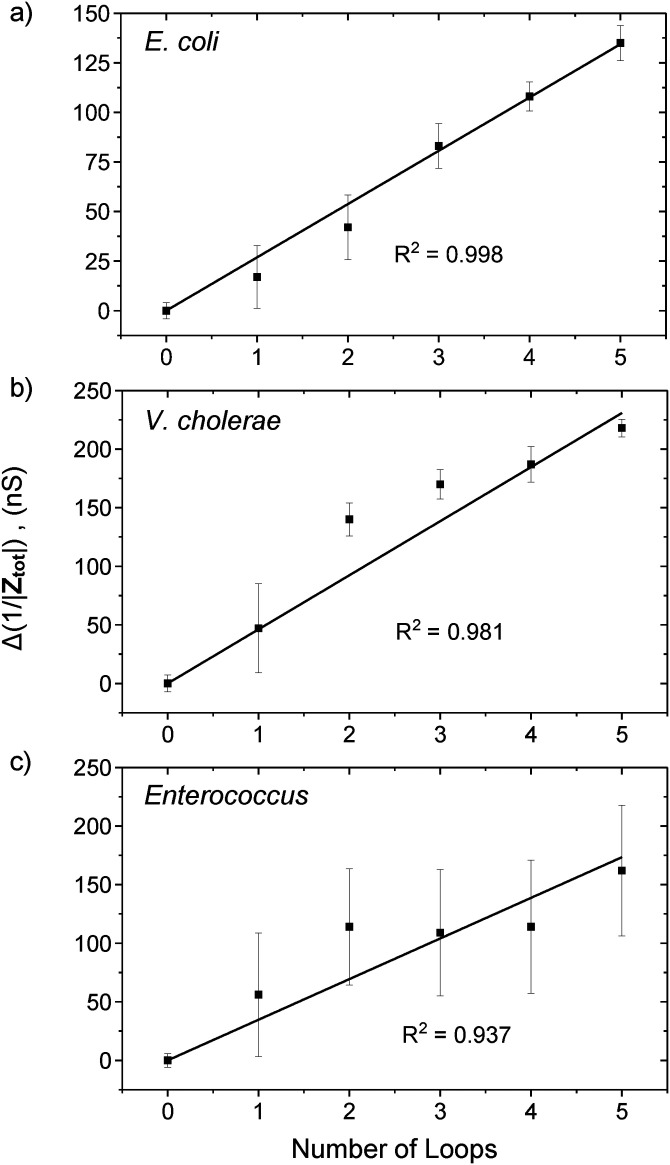
FIG. 5.
Variation of the Δ(1/|Ztot|) with the number of loops of 200 s “ON” and 10 min “OFF” DEP AC voltage cycle for (a) E. coli, (b) V. Cholerae, and (c) Enterococcus. The data points were computed from the average overall system absolute impedance and standard deviation for each of the five loops from Figs. 4(d), 4(f), and 4(h). The system conductance increases in a linear manner with an adjusted goodness of fit R2 of 0.998, 0.981, and 0.937, respectively.

