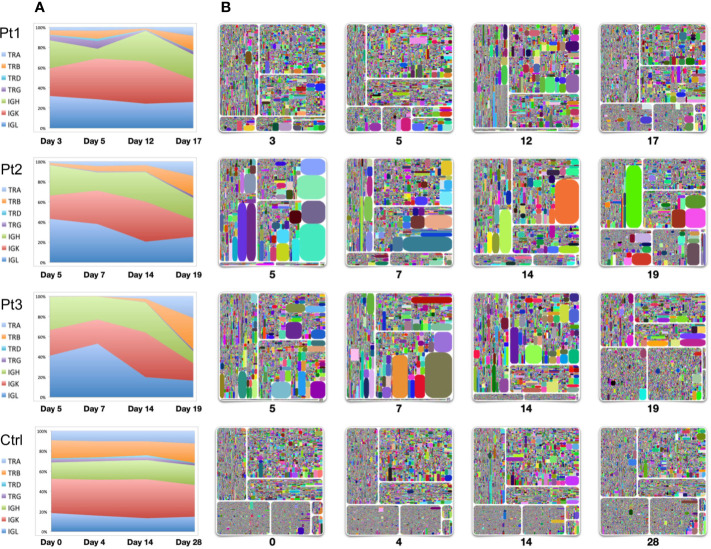
Figure 3.
Longitudinal analysis of TCR and BCR repertoires of four individuals. Samples were collected from three patients from early-mid stages after symptom onset (days 3, 5, 7, 12, 14) to the convalescent stage (days 17, 19). Samples from a healthy seasonal quadrivalent influenza vaccinee before and after vaccination (days 0, 4, 14, and 28) were used as a control. (A) The proportion of TCR-TRA, -TRB, -TRD, -TRG and BCR-IgH, -IgK, -IgL in the adaptive immune reservoirs. (B) Treemap plots representing unique CDR3 clonotypes in each of the seven chains on the indicated time points after symptom onset. The seven treemap plots each represent TCR-beta, -alpha, -delta, -gamma, and BCR-IgH, -IgK, -IgL. A rectangle in a treemap plot represents a unique clonotype. The size of a rectangle denotes the relative frequency of an individual CDR3 sequence, and the varying square size reflects areas of clonal expansion within the immune repertoire sampled. The color of the individual CDR3 sequence in each Treemap plot was randomly chosen, and thus, the colors do not precisely match between individual plots. From the left upper plot clockwise to the bottom plots: IgH, IgK, IgL, TRB, TRA, TRD, and TRG.

