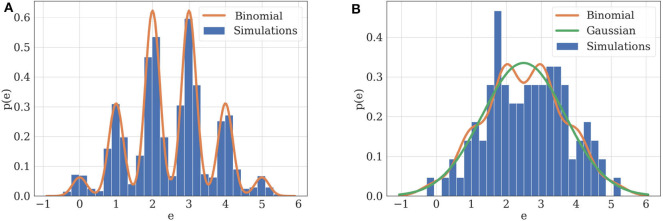
Figure 3.
(A) Illustration of practical identifiability. Orange: theoretical distribution for model parameterized with N = 5, p = 0.5, q = 1, σ = 0.2. Blue: histogram of 2,000 simulated EPSCs generated using the same parameters. Parameters can be precisely inferred from the observations, which fit their theoretical distribution. (B) Illustration of practical non-identifiability. Blue: histogram of 100 simulated EPSCs with N = 5, p = 0.5, q = 1, σ = 0.4. Due to the small number of data points and high recording noise σ, the binomial parameters can only be loosely estimated, which is characterized by the fact that a Gaussian distribution (green) will provide a better fit to the data than a binomial distribution (orange).

