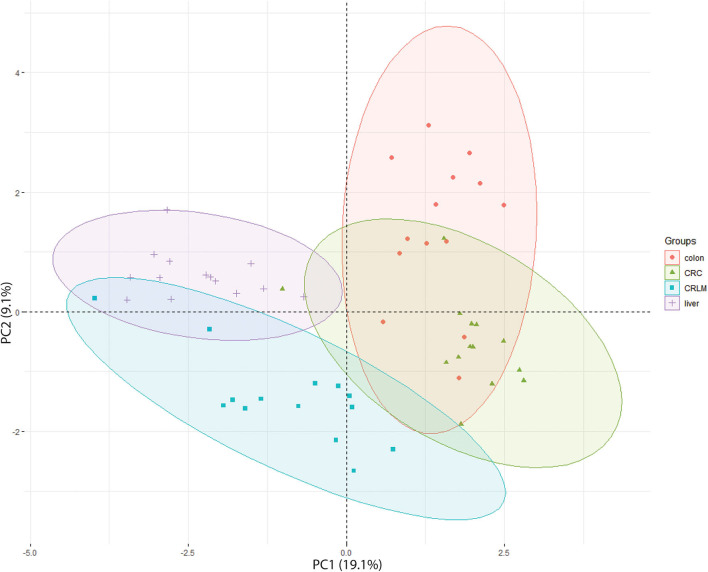
Figure 3.
2D-PCA-plot showing the separation of all 4 tissue types based on their degree of hydroxylation. The x-axis is the first principal component (PC1) of the PCA, which explains 19.1% of the variation. The y-axis is the second principal component (PC2) of the PCA, which explains 9.1% of the variation.

