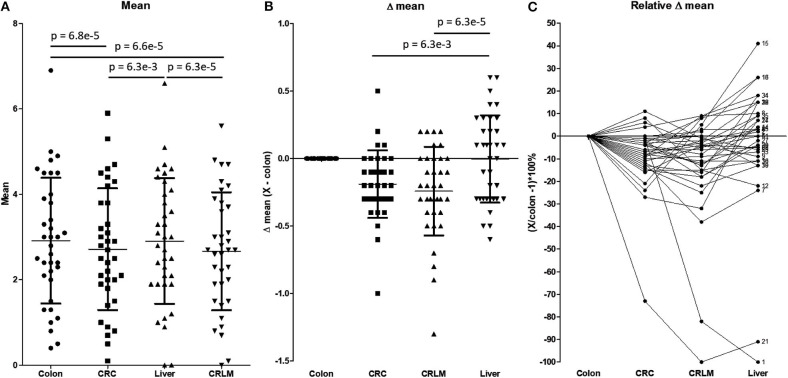
Figure 4.
(A) The average number of hydroxylations per peptide. Tested for differences with a repeated paired t-test. P-values below 0.05/6 = 0.0083 are considered significant. (B) Absolute difference in the average number of hydroxylations per peptide with respect to colon tissue. P-values below 0.05/3 = 0.0167 are considered significant. (C) Relative difference in the number of hydroxylations with respect to colon tissue. The “X” in the legend of the Y-axis represents CRC, CRLM, or liver tissue, depending on the comparison made. Only significant values are presented as horizontal bars in (A) and (B).

