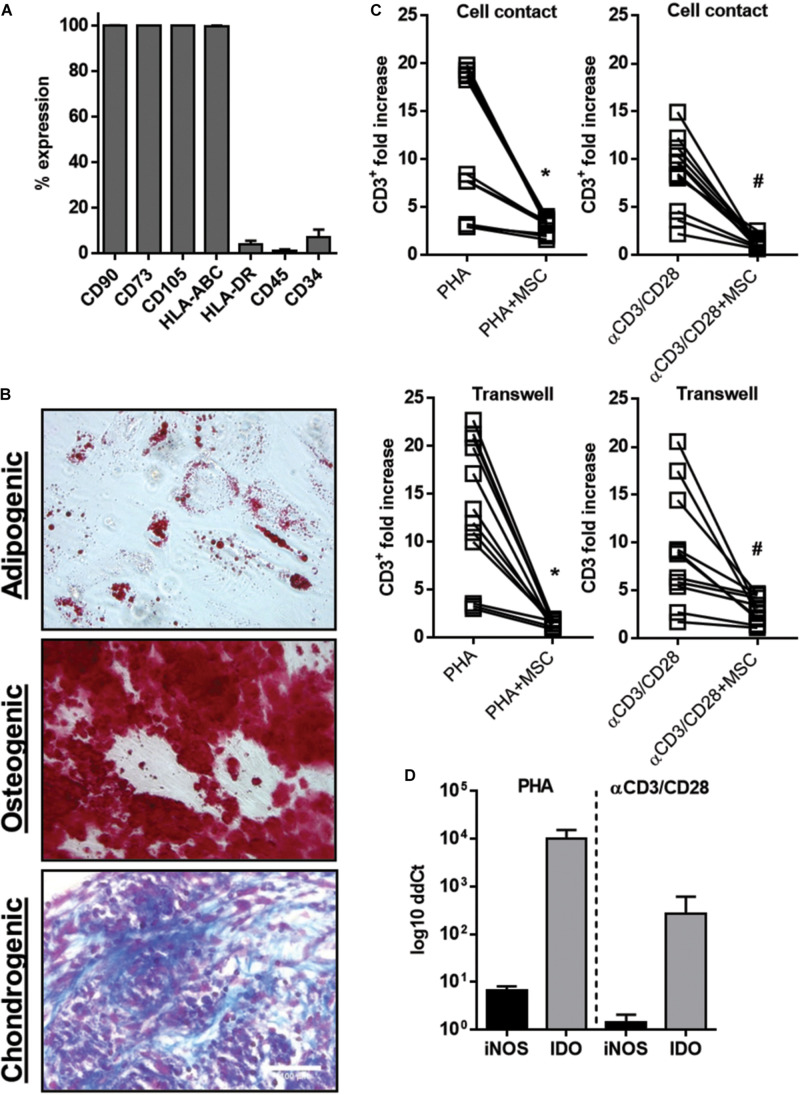
FIGURE 1.
UC-MSC inhibit T cell proliferation induced by PHA and TCR stimulation. (A) Percentage of UC-MSC expressing the cell markers CD90, CD73, CD105, HLA-AB, HLA-DR, CD45, and CD34 (n = 4). (B) Representative micrographies of adipogenic, osteogenic, and chondrogenic differentiation of UC-MSCs in passage 4–5 (n = 4 donors). MSCs were induced to differentiate toward osteogenic lineage and verified by alizarin red staining, adipogenic lineage and verified by Oil Red and chondrogenic lineage, verified by alcian blue (magnification = 100×). (C) PBMNC (n = 4 donors) were stimulated for 5 days with PHA (1 μg/ml) or anti-CD2, -CD3, -CD28 (αCD3/CD28) in presence of UC-MSC (n = 3) in a ratio of 10:1 (PBMNC:UC-MSC). Cells were co-cultured in direct contact or in a transwell system, collected and stained with an anti-CD3 antibody. Absolut CD3 counts were determined by counting beads in a flow cytometer. Fold increase ratio of CD3+ proliferation was calculated relatively to cell numbers of untreated controls. Data is represented in mean ± SEM. *PHA vs. PHA+UC-MSC, p = 0.0001; # αCD3/CD28 vs. αCD3/CD28+UC-MSC, p < 0.00001. (D) RNA from UC-MSC in transwell experiments was collected. Thereafter, a real-time RT-PCR was performed to quantify indolamine-2,3-dioxygenase (IDO) and inducible NO synthase (iNOS) levels. Log10 ddCt values were calculated relative to UC-MSC in basal culture condition.

