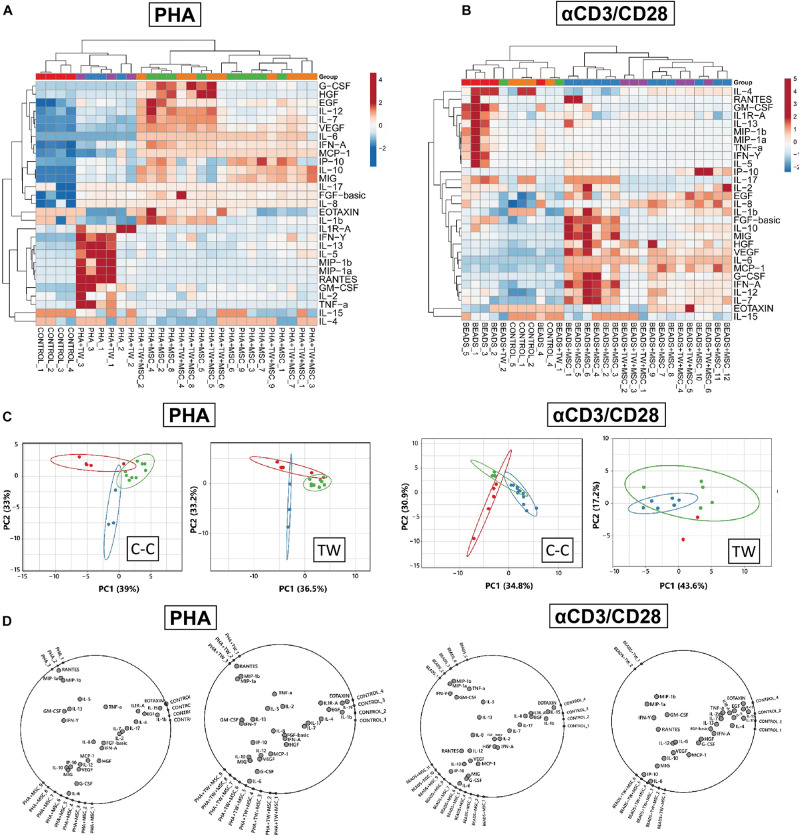
FIGURE 2.
Characterization of immune modulatory secretome in UC-MSC/PBMNC cocultures. Global differences in cytokine concentrations in supernatants from UC-MSC/PBMNC as compared to activated and resting PBMNC in cell-contact and transwell experimental settings were visualized by unsupervised hierarchical clustering in (A) PHA-stimulated and (B) αCD3/CD28-stimulated UC-MSC/PBMNC cocultures. (C) Two-dimensional Principal Component Analyses (PCA) was carried out to determine associations between expression patterns of analyzed factors in PHA and αCD3/CD28 cocultures. (D) Radial visualization (RadViz) analyses showing factors assigned to dimensional anchors placed on the circumference of each circle for PHA and αCD3/CD28 stimulations in cell contact and transwell formats.

