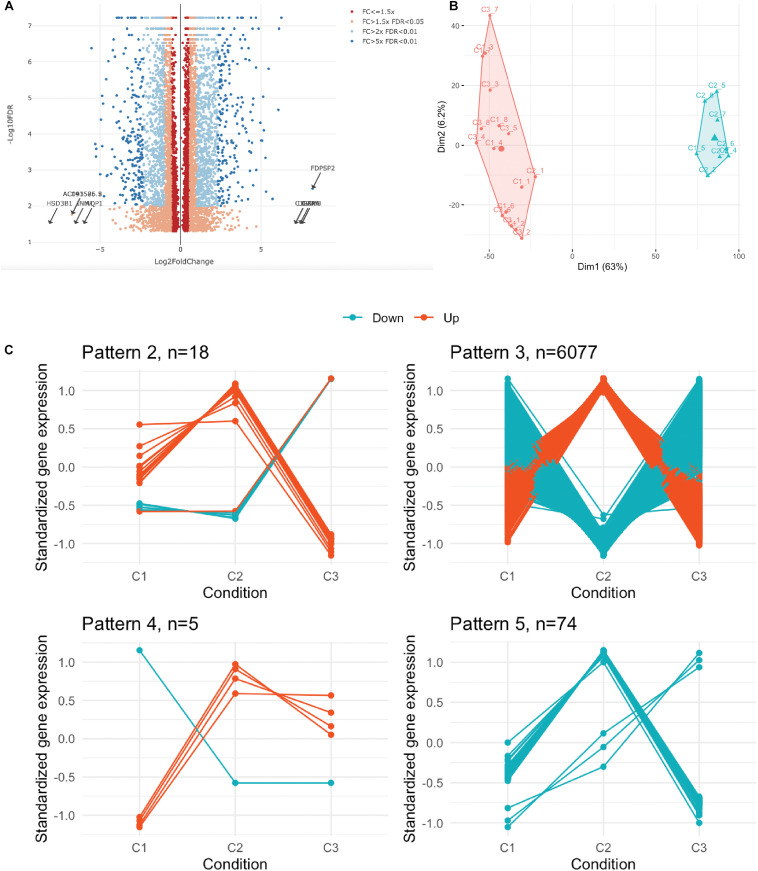
FIGURE 3.
Transcriptome profiling of UC-MSC under experimental inflammation. (A) Volcano plot showing the distribution of all differentially expressed genes. FC, fold change; FDR, false discovery rate. (B) Hierarchical clustering of the 24 transcriptomes based on the normalized counts of differentially expressed genes. (C) Standardized gene expression of DEG in each condition grouped by its identified expression pattern.

